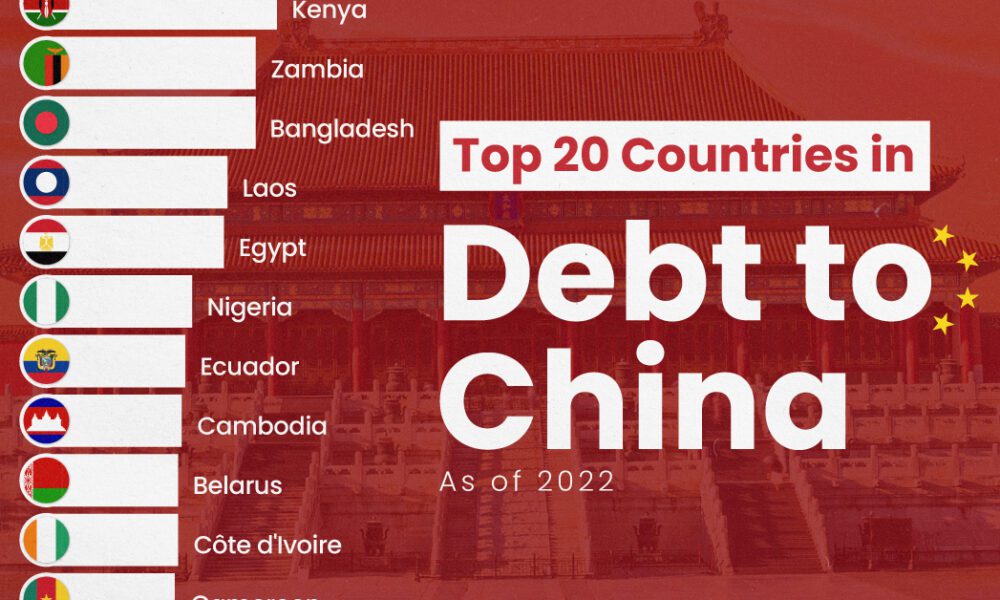
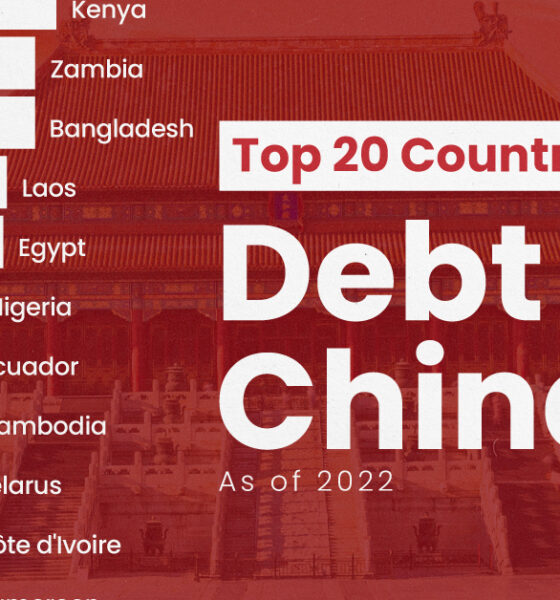
The 20 nations featured in this graphic each owe billions in debt to China, posing concerns for their economic future.

We can’t predict the future, but we can prepare for it. Here’s a look at 5 long-term trends that are set to transform society as we...
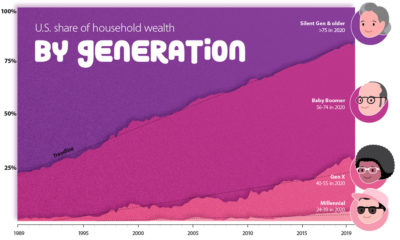

How large is the wealth gap between Millennials, Gen X, and Baby Boomers? We visualize the growing wealth disparity by generation and age.


In some cases, COVID-19 has sped up societal and economic trends that were already in motion. Here we examine five examples.
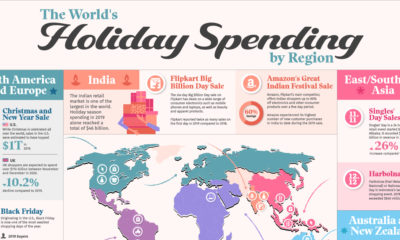

This graphic illustrates some of the largest and most anticipated retail holidays by region and explores their origins.
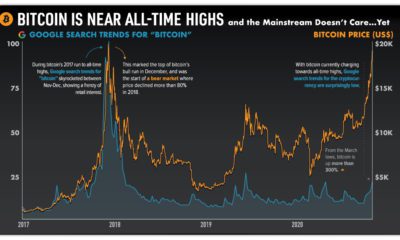

As bitcoin charges towards all-time highs, search interest is relatively low. How much attention has bitcoin's recent rally gotten?
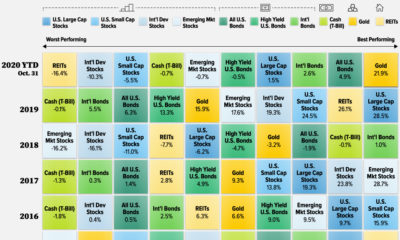

What are the best-performing investments in 2020, and how do previous years compare? This graphic shows historical returns by asset class.
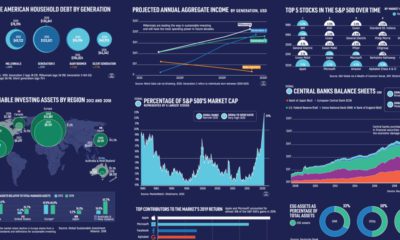

What forces will drive the future of financial markets? We reveal 15 charts from six chapters of our new book to show where the economy is...
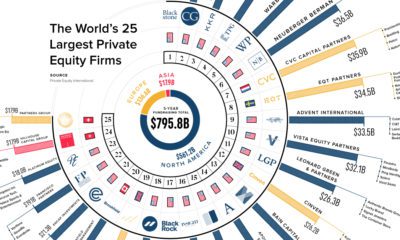

How big is private equity? We show funds raised by the largest 25 private equity firms over the last five years and their notable investments.
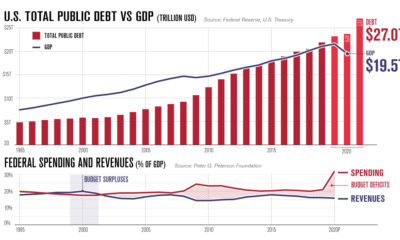

America's debt recently surpassed $27 trillion. In this infographic, we peel back the layers to understand why it keeps on growing.
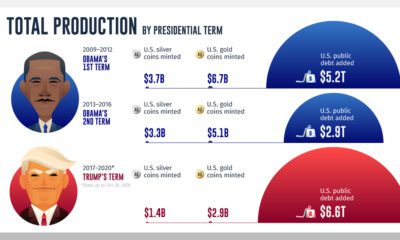

While gold and silver coin production during U.S. presidencies has declined, public debt continues to climb to historically high levels.


