
Lions, tigers, and bears, oh my!—these animals do not feature on this list of popular American household pets.
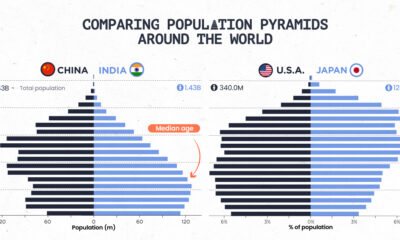

Population pyramids can show a country's demographic advantages and challenges at a glance. See how different parts of the world stack up.


This graphic describes new U.S. renewable energy installations by state along with nameplate capacity, planned to come online in 2023.
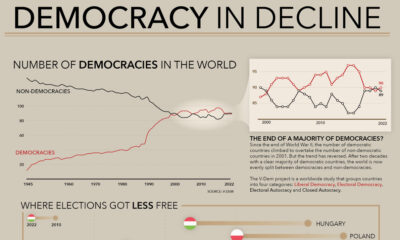

How many democracies does the world have? This visual shows the change since 1945 and the top nations becoming more (and less) democratic.
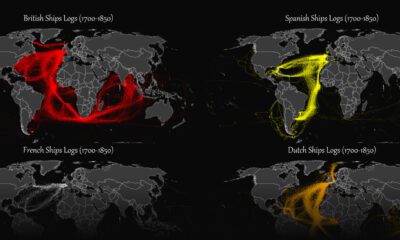

This map plots the colonial shipping lanes used by the British, the French, the Spanish, and the Dutch in the 18th and 19th centuries.
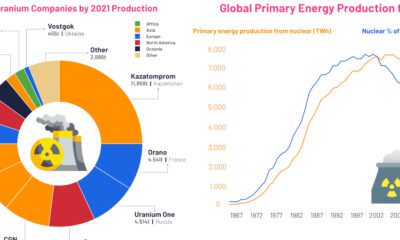

These visuals highlight the uranium mining industry and its output, as well as the trajectory of nuclear energy from 1960 to today.


What does a road map of the world look like? Here’s a deep view of roads visualized by type across countries and continents.
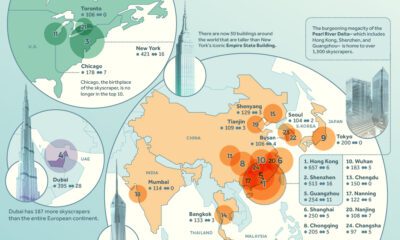

We rank the world's leading cities with the most skyscrapers, highlighting China's remarkable dominance in building vertically.
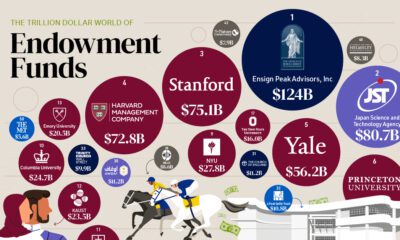

Endowment funds represent the investment arms of nonprofits. See the worlds top 50, which collectively have over $1 trillion in assets.


Reimagining all 200 million of the American workforce as 100 people: where do they all work, what positions they hold, and what jobs they do?
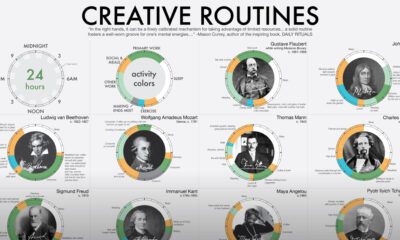

The daily routines of 16 famous creatives—poets, thinkers, scientists and even politicians—are charted for comparison with each other.


 Creator Program