Urbanization
Mapped: All of the World’s Roads, by Continent
Article/Editing:
Click to view this graphic in a higher-resolution.
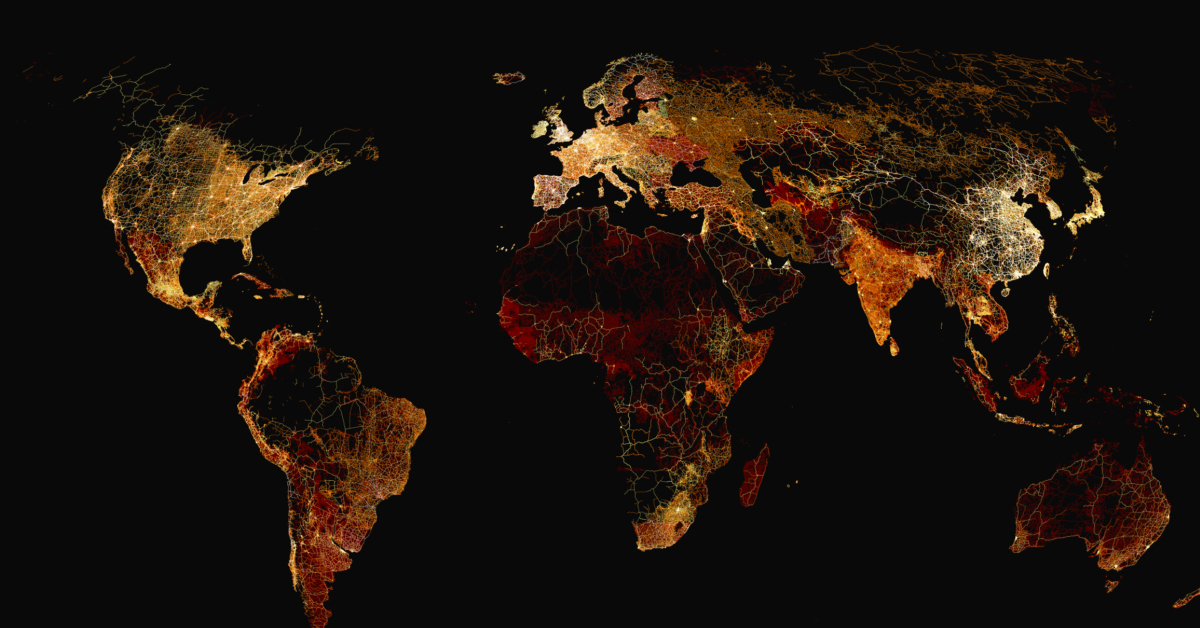
Mapped: All of the World’s Roads, by Continent
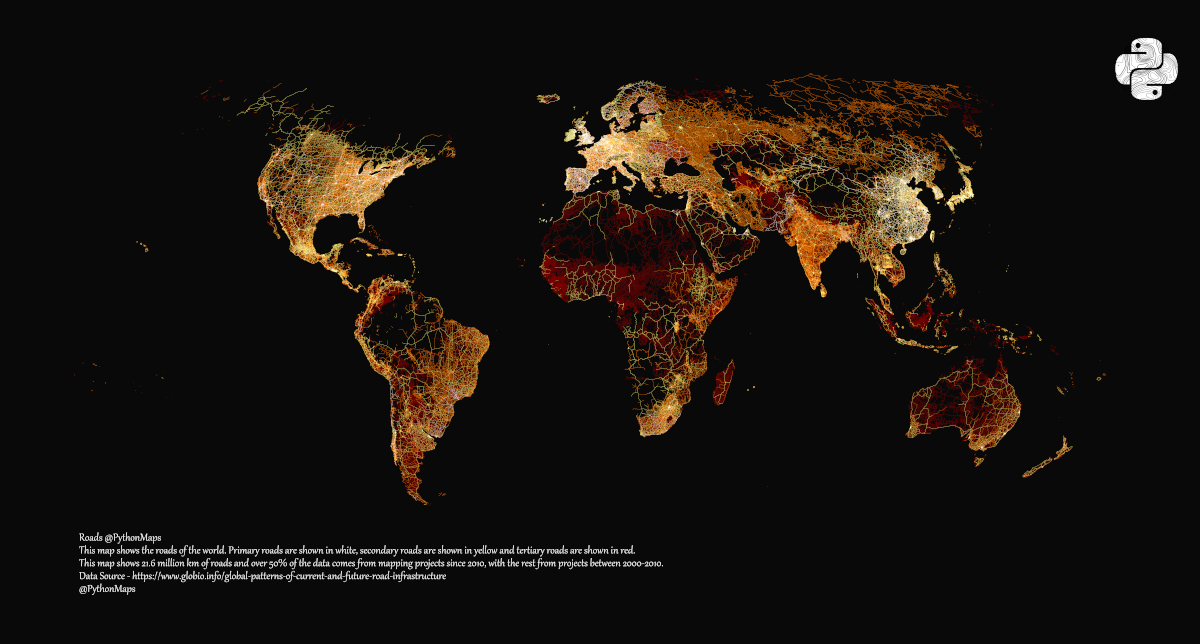
Once upon a time, it was said that all roads led to Rome. Now with at least 21 million kilometers of roads spanning the globe, every continent and country has its own web of crisscrossing connections, from major highways to rural drives.
And there’s no better way to see the scale and spread of roads than by visualizing them. Adam Symington from PythonMaps used data from the Global Roads Inventory Project (GRIP) to map all the roads in the world, creating an accurate representation of humanity’s need to connect.
Creating the Global Road Map
The GRIP database pulled information from a variety of sources including governments, research institutes, NGOs, and crowd-sourcing initiatives to create a harmonized dataset of geospatial road information for a 2018 paper, “Global patterns of current and future road infrastructure.”
Researchers categorized roads into types using a UN classification system, which have been visualized in three colors on this map:
| Category | Definition | Color |
|---|---|---|
| Main Roads | Highways + primary roads between and within cities and towns. Multi-lane, limited entry and exit points. | White |
| Secondary Roads | Paved, high-traffic, access between neighborhoods | Yellow |
| Tertiary Roads | Paved or unpaved residential access within neighborhoods, or rural points of interest. | Red |
| Local Roads | All other smaller roads that don't fit above, and usually are not throughfare. | Red |
This classification allowed for examining relationships between road infrastructure, development, wealth, and population distribution.
Which Country has the Largest Road Map?
With nearly 3 million kilometers of motorways, the U.S. has the largest road network in the world, nearly double that of China (1.7 million km) and three times that of India (1 million km).
| Rank (#) | Country | All Roads (km) | % of World's Roads |
|---|---|---|---|
| 1 | U.S. | 3,097,278 | 14.34% |
| 2 | China | 1,709,997 | 7.92% |
| 3 | India | 1,052,718 | 4.87% |
| 4 | Mexico | 741,949 | 3.43% |
| 5 | Argentina | 703,087 | 3.25% |
| 6 | Brazil | 681,267 | 3.15% |
| 7 | Russia | 621,813 | 2.88% |
| 8 | Australia | 620,393 | 2.87% |
| 9 | Germany | 563,155 | 2.61% |
| 10 | France | 523,566 | 2.42% |
| 11 | Japan | 452,440 | 2.09% |
| 12 | Turkey | 448,249 | 2.08% |
| 13 | Indonesia | 429,970 | 1.99% |
| 14 | Colombia | 387,471 | 1.79% |
| 15 | South Africa | 331,909 | 1.54% |
| 16 | Kazakhstan | 303,170 | 1.40% |
| 17 | Spain | 273,597 | 1.27% |
| 18 | UK | 268,709 | 1.24% |
| 19 | Thailand | 264,639 | 1.23% |
| 20 | Italy | 263,304 | 1.22% |
| 21 | Canada | 243,155 | 1.13% |
| 22 | Ukraine | 229,380 | 1.06% |
| 23 | Poland | 224,904 | 1.04% |
| 24 | Turkmenistan | 204,100 | 0.94% |
| 25 | Peru | 203,726 | 0.94% |
| 26 | Vietnam | 187,599 | 0.87% |
| 27 | Bangladesh | 183,317 | 0.85% |
| 28 | Somalia | 163,093 | 0.76% |
| 29 | Dem. Rep. Congo | 162,174 | 0.75% |
| 30 | Iran | 145,177 | 0.67% |
| 31 | Iraq | 140,365 | 0.65% |
| 32 | Angola | 135,627 | 0.63% |
| 33 | Sweden | 121,673 | 0.56% |
| 34 | South Korea | 119,456 | 0.55% |
| 35 | Venezuela | 118,378 | 0.55% |
| 36 | Libya | 117,504 | 0.54% |
| 37 | Bolivia | 108,594 | 0.50% |
| 38 | Pakistan | 106,183 | 0.49% |
| 39 | Sudan | 101,345 | 0.47% |
| 40 | Guinea | 101,324 | 0.47% |
| 41 | New Zealand | 100,404 | 0.46% |
| 42 | Philippines | 96,466 | 0.45% |
| 43 | Sri Lanka | 96,023 | 0.44% |
| 44 | Kenya | 94,339 | 0.44% |
| 45 | Chile | 93,030 | 0.43% |
| 46 | Nigeria | 92,469 | 0.43% |
| 47 | Austria | 90,284 | 0.42% |
| 48 | Finland | 89,386 | 0.41% |
| 49 | Czech Republic | 89,266 | 0.41% |
| 50 | Saudi Arabia | 86,188 | 0.40% |
| 51 | Greece | 86,128 | 0.40% |
| 52 | Afghanistan | 83,186 | 0.39% |
| 53 | Belarus | 80,824 | 0.37% |
| 54 | Ecuador | 80,290 | 0.37% |
| 55 | Myanmar | 79,401 | 0.37% |
| 56 | Ethiopia | 79,306 | 0.37% |
| 57 | Netherlands | 77,793 | 0.36% |
| 58 | Senegal | 74,928 | 0.35% |
| 59 | Taiwan | 72,870 | 0.34% |
| 60 | Cameroon | 71,882 | 0.33% |
| 61 | Madagascar | 71,341 | 0.33% |
| 62 | Zimbabwe | 70,503 | 0.33% |
| 63 | Uruguay | 69,587 | 0.32% |
| 64 | Norway | 66,204 | 0.31% |
| 65 | Portugal | 65,181 | 0.30% |
| 66 | Belgium | 65,098 | 0.30% |
| 67 | Uzbekistan | 64,445 | 0.30% |
| 68 | Romania | 63,333 | 0.29% |
| 69 | Botswana | 63,130 | 0.29% |
| 70 | Mali | 59,142 | 0.27% |
| 71 | Mozambique | 58,693 | 0.27% |
| 72 | Cuba | 56,883 | 0.26% |
| 73 | Hungary | 56,209 | 0.26% |
| 74 | Algeria | 55,662 | 0.26% |
| 75 | Cambodia | 54,500 | 0.25% |
| 76 | Egypt | 52,580 | 0.24% |
| 77 | Chad | 52,257 | 0.24% |
| 78 | Denmark | 50,256 | 0.23% |
| 79 | Mauritania | 50,056 | 0.23% |
| 80 | Mongolia | 49,873 | 0.23% |
| 81 | Switzerland | 46,046 | 0.21% |
| 82 | Ivory Coast | 45,807 | 0.21% |
| 83 | Niger | 44,638 | 0.21% |
| 84 | Bulgaria | 44,225 | 0.20% |
| 85 | Paraguay | 43,298 | 0.20% |
| 86 | Yemen | 42,476 | 0.20% |
| 87 | Tanzania | 42,000 | 0.19% |
| 88 | North Korea | 41,932 | 0.19% |
| 89 | Zambia | 40,581 | 0.19% |
| 90 | Guatemala | 40,413 | 0.19% |
| 91 | Namibia | 40,131 | 0.19% |
| 92 | Ireland | 39,620 | 0.18% |
| 93 | Morocco | 39,479 | 0.18% |
| 94 | Papua New Guinea | 37,960 | 0.18% |
| 95 | Malaysia | 37,237 | 0.17% |
| 96 | Nepal | 36,791 | 0.17% |
| 97 | Croatia | 34,870 | 0.16% |
| 98 | Syria | 34,433 | 0.16% |
| 99 | Sierra Leone | 33,559 | 0.16% |
| 100 | Slovakia | 33,136 | 0.15% |
| 101 | Albania | 33,022 | 0.15% |
| 102 | South Sudan | 32,277 | 0.15% |
| 103 | Burkina Faso | 31,046 | 0.14% |
| 104 | Laos | 28,924 | 0.13% |
| 105 | El Salvador | 28,506 | 0.13% |
| 106 | Ghana | 28,024 | 0.13% |
| 107 | Kyrgyzstan | 27,850 | 0.13% |
| 108 | Latvia | 26,808 | 0.12% |
| 109 | Rwanda | 26,714 | 0.12% |
| 110 | Lithuania | 26,144 | 0.12% |
| 111 | Nicaragua | 25,373 | 0.12% |
| 112 | Central African Republic | 25,249 | 0.12% |
| 113 | Israel | 24,801 | 0.11% |
| 114 | Congo | 24,616 | 0.11% |
| 115 | Liberia | 24,507 | 0.11% |
| 116 | Oman | 23,546 | 0.11% |
| 117 | Jamaica | 23,193 | 0.11% |
| 118 | Serbia | 21,858 | 0.10% |
| 119 | Benin | 21,289 | 0.10% |
| 120 | Tunisia | 20,765 | 0.10% |
| 121 | Uganda | 19,523 | 0.09% |
| 122 | Mauritius | 19,434 | 0.09% |
| 123 | Jordan | 19,284 | 0.09% |
| 124 | U.A.E | 19,198 | 0.09% |
| 125 | Costa Rica | 18,924 | 0.09% |
| 126 | Estonia | 18,551 | 0.09% |
| 127 | Haiti | 18,169 | 0.08% |
| 128 | Burundi | 17,450 | 0.08% |
| 129 | Tajikistan | 16,086 | 0.07% |
| 130 | East Timor | 16,048 | 0.07% |
| 131 | Iceland | 15,374 | 0.07% |
| 132 | Azerbaijan | 15,361 | 0.07% |
| 133 | Honduras | 15,200 | 0.07% |
| 134 | Guinea-Bissau | 13,636 | 0.06% |
| 135 | Malawi | 13,238 | 0.06% |
| 136 | Puerto Rico | 12,934 | 0.06% |
| 137 | Palestine | 12,817 | 0.06% |
| 138 | Slovenia | 12,474 | 0.06% |
| 139 | Gabon | 12,286 | 0.06% |
| 140 | Cyprus | 11,721 | 0.05% |
| 141 | Lebanon | 11,399 | 0.05% |
| 142 | Dominican Republic | 10,890 | 0.05% |
| 143 | Panama | 10,417 | 0.05% |
| 144 | Armenia | 9,888 | 0.05% |
| 145 | Belize | 9,817 | 0.05% |
| 146 | Qatar | 9,047 | 0.04% |
| 147 | Moldova | 8,860 | 0.04% |
| 148 | Georgia | 8,043 | 0.04% |
| 149 | Bosnia | 7,769 | 0.04% |
| 150 | Togo | 7,423 | 0.03% |
| 151 | Eritrea | 7,101 | 0.03% |
| 152 | Western Sahara | 6,794 | 0.03% |
| 153 | Djibouti | 6,786 | 0.03% |
| 154 | Gambia | 5,112 | 0.02% |
| 155 | Luxembourg | 5,106 | 0.02% |
| 156 | Guyana | 4,323 | 0.02% |
| 157 | Guadeloupe | 4,303 | 0.02% |
| 158 | Northern Macedonia | 4,150 | 0.02% |
| 159 | Singapore | 3,547 | 0.02% |
| 160 | French Guiana | 3,316 | 0.02% |
| 161 | Lesotho | 3,157 | 0.01% |
| 162 | Martinique | 2,857 | 0.01% |
| 163 | Montenegro | 2,810 | 0.01% |
| 164 | Eswatini | 2,664 | 0.01% |
| 165 | Equatorial Guinea | 2,609 | 0.01% |
| 166 | Netherlands Antilles | 2,549 | 0.01% |
| 167 | Cabo Verde | 2,392 | 0.01% |
| 168 | Bhutan | 2,376 | 0.01% |
| 169 | New Caledonia | 2,213 | 0.01% |
| 170 | Suriname | 1,921 | 0.01% |
| 171 | Barbados | 1,806 | 0.01% |
| 172 | Kuwait | 1,651 | 0.01% |
| 173 | Malta | 1,637 | 0.01% |
| 174 | U.S. Virgin Islands | 1,429 | 0.01% |
| 175 | Solomon Islands | 1,309 | 0.01% |
| 176 | The Bahamas | 1,285 | 0.01% |
| 177 | Fiji | 1,134 | 0.01% |
| 178 | Antigua and Barbuda | 1,125 | 0.01% |
| 179 | Kosovo | 1,111 | 0.01% |
| 180 | Aruba | 890 | 0.00% |
| 181 | Dominica | 862 | 0.00% |
| 182 | Faroe Islands | 826 | 0.00% |
| 183 | St. Lucia | 793 | 0.00% |
| 184 | Cayman Islands | 746 | 0.00% |
| 185 | Brunei | 660 | 0.00% |
| 186 | Trinidad and Tobago | 636 | 0.00% |
| 187 | Isle of Man | 610 | 0.00% |
| 188 | Sao Tome and Principe | 538 | 0.00% |
| 189 | Grenada | 516 | 0.00% |
| 190 | Bahrain | 502 | 0.00% |
| 191 | Falkland Island | 485 | 0.00% |
| 192 | Reunion | 465 | 0.00% |
| 193 | St. Kitts and Nevis | 446 | 0.00% |
| 194 | Vanuatu | 445 | 0.00% |
| 195 | St. Vincent & the Grenadines | 389 | 0.00% |
| 196 | Comoros | 384 | 0.00% |
| 197 | Samoa | 342 | 0.00% |
| 198 | British Virgin Islands | 297 | 0.00% |
| 199 | Anguila | 209 | 0.00% |
| 200 | Guam | 201 | 0.00% |
| 201 | French Polynesia | 175 | 0.00% |
| 202 | Northern Mariana Islands | 145 | 0.00% |
| 203 | Tonga | 135 | 0.00% |
| 204 | Montserrat | 125 | 0.00% |
| 205 | San Marino | 118 | 0.00% |
| 206 | Mayotte | 109 | 0.00% |
| 207 | Niue | 91 | 0.00% |
| 208 | Turks & Caicos Island | 75 | 0.00% |
| 209 | Seychelles | 70 | 0.00% |
| 210 | Saint Helena | 57 | 0.00% |
| 211 | Cook Islands | 47 | 0.00% |
| 212 | Monaco | 42 | 0.00% |
| 213 | Andorra | 36 | 0.00% |
| 214 | Gibraltar | 29 | 0.00% |
| 215 | Wallis & Futura Islands | 25 | 0.00% |
| 216 | Liechtenstein | 24 | 0.00% |
| 217 | Palau | 18 | 0.00% |
| 218 | American Samoa | 17 | 0.00% |
| 219 | French Southern & Antarctic Lands | 15 | 0.00% |
| 220 | Bermuda | 14 | 0.00% |
| 221 | Christmas Island | 12 | 0.00% |
| 222 | Norfolk Island | 10 | 0.00% |
| Total | 21,600,760 | 100% |
The small Pacific island country of Palau has the smallest road network in the database measuring 18 kilometers. However, many overseas territories of countries have even smaller networks, with Norfolk Island being the smallest in the dataset at 10 km.
That said, when breaking the road networks down by type, the rankings change significantly.
China muscles out the U.S. with nearly double the amount of main roads (highways + primary roads). Meanwhile, Japan and Canada climb into the top 10 by largest main road networks, while India drops down to #8.
| Country | Main | Secondary | Tertiary | Local |
|---|---|---|---|---|
| China | 683,248 | 306,176 | 373,831 | 346,742 |
| U.S. | 366,800 | 898,873 | 42,071 | 1,789,534 |
| Mexico | 105,822 | 181,088 | 185,587 | 269,452 |
| Japan | 94,451 | 67,454 | 100,536 | 189,999 |
| Canada | 91,173 | 73,525 | 46,121 | 32,336 |
| Brazil | 86,772 | 223,662 | 283,933 | 86,900 |
| France | 74,956 | 114,433 | 192,191 | 141,986 |
| India | 69,748 | 413,790 | 526,130 | 43,050 |
| Argentina | 69,188 | 55,519 | 534,876 | 43,504 |
| Australia | 69,138 | 73,376 | 426,346 | 51,533 |
| Spain | 64,628 | 37,571 | 80,094 | 91,304 |
| UK | 63,673 | 30,999 | 48,605 | 125,432 |
| Germany | 63,517 | 97,272 | 100,513 | 301,853 |
| Turkey | 59,013 | 40,863 | 203,987 | 144,386 |
| South Africa | 56,262 | 103,332 | 138,895 | 33,420 |
| Russia | 52,920 | 512,386 | 33,742 | 22,765 |
| Kazakhstan | 47,393 | 41,074 | 149,963 | 64,740 |
| Italy | 47,098 | 51,038 | 84,147 | 81,021 |
| Thailand | 45,445 | 49,924 | 129,724 | 39,546 |
| South Korea | 33,590 | 24,399 | 20,517 | 40,950 |
| Peru | 31,361 | 47,296 | 115,038 | 10,031 |
| Indonesia | 29,346 | 23,324 | 334,164 | 43,136 |
| Norway | 27,175 | 19,057 | 5,377 | 14,595 |
| Iran | 23,722 | 98,687 | 5,953 | 16,815 |
| Chile | 21,078 | 41,353 | 20,274 | 10,325 |
| Colombia | 20,884 | 43,084 | 309,725 | 13,778 |
| Sweden | 20,562 | 25,438 | 45,807 | 29,866 |
| Poland | 20,432 | 29,499 | 67,151 | 107,822 |
| Dem. Rep. Congo | 20,209 | 29,387 | 109,962 | 2,616 |
| Ethiopia | 19,920 | 22,006 | 33,409 | 3,971 |
| Venezuela | 19,663 | 13,822 | 74,656 | 10,237 |
| Pakistan | 19,186 | 25,672 | 55,535 | 5,790 |
| Belarus | 17,720 | 29,644 | 30,928 | 2,532 |
| Ireland | 17,540 | 0 | 15,379 | 6,701 |
| Romania | 17,127 | 18,403 | 9,745 | 18,058 |
| Philippines | 17,077 | 15,267 | 42,811 | 21,311 |
| Saudi Arabia | 16,860 | 8,020 | 45,593 | 15,715 |
| Myanmar | 16,527 | 13,462 | 45,041 | 4,371 |
| Ukraine | 16,342 | 33,147 | 170,020 | 9,871 |
| Uzbekistan | 16,127 | 44,000 | 3,557 | 761 |
| Portugal | 15,545 | 9,186 | 18,646 | 21,804 |
| Finland | 14,847 | 16,030 | 33,043 | 25,466 |
| Vietnam | 13,800 | 17,635 | 152,901 | 3,263 |
| Zimbabwe | 13,482 | 18,803 | 34,883 | 3,335 |
| Austria | 13,413 | 12,878 | 15,470 | 48,523 |
| Bangladesh | 13,272 | 21,723 | 137,497 | 10,825 |
| New Zealand | 12,522 | 6,913 | 64,498 | 16,471 |
| Iraq | 12,418 | 53,285 | 71,012 | 3,650 |
| Greece | 11,533 | 12,284 | 34,815 | 27,496 |
| Netherlands | 11,466 | 7,425 | 18,460 | 40,442 |
| Taiwan | 11,440 | 8,899 | 39,987 | 12,544 |
| Uruguay | 10,314 | 0 | 59,160 | 113 |
| Croatia | 9,844 | 11,043 | 6,506 | 7,477 |
| Mongolia | 9,061 | 40,812 | 0 | 0 |
| Belgium | 9,048 | 7,281 | 12,661 | 36,108 |
| El Salvador | 8,984 | 8,424 | 11,072 | 26 |
| U.A.E | 8,889 | 3,172 | 2,043 | 5,094 |
| Hungary | 8,732 | 11,512 | 11,819 | 24,146 |
| Algeria | 8,675 | 6,407 | 36,187 | 4,393 |
| Nicaragua | 8,060 | 14,212 | 1,255 | 1,846 |
| Bolivia | 7,957 | 8,091 | 82,960 | 9,586 |
| Czech Republic | 7,877 | 15,232 | 35,640 | 30,517 |
| Sri Lanka | 7,704 | 15,715 | 70,536 | 2,068 |
| Nigeria | 7,545 | 8,119 | 68,572 | 8,233 |
| Latvia | 7,519 | 10,213 | 4,134 | 4,942 |
| Lithuania | 7,452 | 5,107 | 7,480 | 6,105 |
| North Korea | 7,338 | 7,775 | 20,167 | 6,652 |
| Switzerland | 7,278 | 5,303 | 10,821 | 22,644 |
| Libya | 7,277 | 5,615 | 80,985 | 23,627 |
| Ivory Coast | 7,030 | 7,531 | 29,015 | 2,231 |
| Laos | 6,882 | 4,089 | 17,749 | 204 |
| Angola | 6,691 | 10,588 | 114,680 | 3,668 |
| Mozambique | 6,686 | 23,425 | 27,266 | 1,316 |
| Yemen | 6,647 | 503 | 34,020 | 1,306 |
| Syria | 6,440 | 6,834 | 16,624 | 4,535 |
| Kyrgyzstan | 6,121 | 18,927 | 1,039 | 1,763 |
| Malaysia | 6,022 | 16,713 | 14,020 | 482 |
| Egypt | 5,872 | 5,678 | 35,611 | 5,419 |
| Israel | 5,850 | 5,095 | 12,063 | 1,793 |
| Kenya | 5,792 | 28,241 | 57,725 | 2,581 |
| Ecuador | 5,725 | 11,034 | 55,207 | 8,324 |
| Papua New Guinea | 5,620 | 7,168 | 25,172 | 0 |
| Qatar | 5,570 | 2,046 | 588 | 843 |
| Serbia | 5,536 | 5,246 | 3,832 | 7,244 |
| Cuba | 5,373 | 6,285 | 29,485 | 15,740 |
| Paraguay | 5,144 | 13,669 | 21,767 | 2,718 |
| Albania | 5,121 | 6,249 | 21,641 | 11 |
| Denmark | 5,053 | 6,113 | 6,556 | 32,534 |
| Botswana | 4,979 | 8,314 | 49,837 | 0 |
| Sudan | 4,859 | 5,142 | 81,954 | 9,390 |
| Turkmenistan | 4,731 | 24,952 | 174,410 | 7 |
| Morocco | 4,727 | 2,424 | 28,105 | 4,223 |
| Iceland | 4,666 | 3,291 | 5,934 | 1,483 |
| Zambia | 4,648 | 3,806 | 31,113 | 1,014 |
| Somalia | 4,605 | 32,248 | 125,418 | 822 |
| Slovakia | 4,317 | 3,723 | 10,318 | 14,778 |
| Tunisia | 4,232 | 2,606 | 9,679 | 4,248 |
| Afghanistan | 4,189 | 2,204 | 75,762 | 1,031 |
| Bulgaria | 4,090 | 4,533 | 24,534 | 11,068 |
| Panama | 3,887 | 3,718 | 2,811 | 1 |
| Tanzania | 3,852 | 4,575 | 31,734 | 1,839 |
| Oman | 3,435 | 2,588 | 15,395 | 2,128 |
| Mali | 3,432 | 3,080 | 48,397 | 4,233 |
| Malawi | 3,352 | 7,122 | 2,625 | 139 |
| Bosnia | 3,239 | 1,332 | 2,529 | 669 |
| Jordan | 3,021 | 2,119 | 7,722 | 6,422 |
| Namibia | 2,904 | 2,146 | 35,073 | 8 |
| Azerbaijan | 2,889 | 7,265 | 346 | 4,861 |
| Madagascar | 2,799 | 3,779 | 63,672 | 1,091 |
| Niger | 2,751 | 2,099 | 38,633 | 1,155 |
| Guatemala | 2,745 | 10,431 | 20,632 | 6,605 |
| Congo | 2,733 | 11,063 | 7,089 | 3,731 |
| Tajikistan | 2,639 | 13,447 | 0 | 0 |
| Honduras | 2,625 | 4,696 | 5,421 | 2,458 |
| Costa Rica | 2,608 | 11,277 | 361 | 4,678 |
| Puerto Rico | 2,543 | 2,539 | 3,415 | 4,437 |
| Rwanda | 2,299 | 4,215 | 19,609 | 591 |
| Cambodia | 2,231 | 11,481 | 38,387 | 2,401 |
| Benin | 2,225 | 5,104 | 13,281 | 679 |
| Slovenia | 2,223 | 2,686 | 3,689 | 3,876 |
| Lebanon | 2,164 | 2,368 | 4,097 | 2,770 |
| Ghana | 2,107 | 8,051 | 12,883 | 4,983 |
| Senegal | 2,051 | 5,437 | 64,354 | 3,086 |
| Uganda | 2,024 | 346 | 16,224 | 929 |
| Burkina Faso | 2,021 | 10,087 | 15,747 | 3,191 |
| Jamaica | 1,972 | 5,193 | 15,495 | 533 |
| Bhutan | 1,871 | 0 | 499 | 6 |
| Estonia | 1,859 | 3,065 | 9,745 | 3,882 |
| Mauritania | 1,738 | 2,185 | 45,204 | 929 |
| Nepal | 1,728 | 3,644 | 30,100 | 1,319 |
| Burundi | 1,714 | 7,571 | 8,121 | 44 |
| Cameroon | 1,574 | 3,453 | 64,095 | 2,760 |
| Singapore | 1,561 | 417 | 193 | 1,376 |
| Cyprus | 1,488 | 2,311 | 2,266 | 5,656 |
| Kuwait | 1,334 | 128 | 64 | 125 |
| Northern Macedonia | 1,332 | 1,421 | 991 | 406 |
| South Sudan | 1,266 | 4,974 | 26,030 | 7 |
| Armenia | 1,231 | 2,874 | 1,578 | 4,205 |
| Georgia | 1,192 | 5,412 | 198 | 1,241 |
| Moldova | 1,190 | 2,898 | 4,751 | 21 |
| Luxembourg | 1,186 | 1,916 | 381 | 1,623 |
| East Timor | 1,180 | 680 | 14,066 | 122 |
| Dominican Republic | 1,148 | 3,809 | 1,152 | 4,781 |
| Haiti | 1,089 | 1,347 | 13,913 | 1,820 |
| Palestine | 1,035 | 751 | 2,412 | 8,619 |
| Suriname | 1,030 | 891 | 0 | 0 |
| Togo | 855 | 970 | 2,927 | 2,671 |
| Montenegro | 842 | 519 | 809 | 640 |
| Belize | 680 | 5,153 | 3,984 | 0 |
| Djibouti | 675 | 1,673 | 4,438 | 0 |
| Eswatini | 648 | 1,061 | 955 | 0 |
| Bahrain | 502 | 0 | 0 | 0 |
| Guinea | 486 | 8,379 | 90,320 | 2,139 |
| Eritrea | 477 | 30 | 6,592 | 2 |
| French Guiana | 475 | 1,822 | 993 | 26 |
| Central African Republic | 459 | 1,861 | 22,924 | 5 |
| Liberia | 445 | 4,563 | 19,498 | 1 |
| Guadeloupe | 438 | 523 | 2,017 | 1,325 |
| Sierra Leone | 419 | 4,891 | 27,374 | 875 |
| Fiji | 407 | 727 | 0 | 0 |
| Kosovo | 366 | 449 | 296 | 0 |
| New Caledonia | 340 | 1,873 | 0 | 0 |
| Isle of Man | 336 | 120 | 21 | 133 |
| Martinique | 323 | 442 | 1,211 | 881 |
| Netherlands Antilles | 310 | 151 | 747 | 1,341 |
| Chad | 304 | 1,958 | 48,767 | 1,228 |
| Mauritius | 277 | 790 | 15,209 | 3,158 |
| Lesotho | 267 | 635 | 2,250 | 5 |
| Faroe Islands | 246 | 130 | 42 | 408 |
| Barbados | 244 | 364 | 361 | 837 |
| Malta | 228 | 223 | 173 | 1,013 |
| Dominica | 224 | 60 | 237 | 341 |
| U.S. Virgin Islands | 211 | 129 | 71 | 1,018 |
| Reunion | 190 | 146 | 129 | 0 |
| Western Sahara | 182 | 568 | 6,041 | 3 |
| Gabon | 181 | 945 | 11,150 | 10 |
| Grenada | 173 | 55 | 175 | 113 |
| Cayman Islands | 168 | 55 | 90 | 433 |
| Antigua and Barbuda | 134 | 53 | 343 | 595 |
| Sao Tome and Principe | 123 | 0 | 415 | 0 |
| Guam | 123 | 78 | 0 | 0 |
| St. Lucia | 115 | 51 | 394 | 233 |
| Cabo Verde | 99 | 333 | 1,959 | 1 |
| Northern Mariana Islands | 87 | 58 | 0 | 0 |
| Gambia | 85 | 1,400 | 3,612 | 15 |
| British Virgin Islands | 72 | 39 | 119 | 67 |
| Guinea-Bissau | 71 | 3,301 | 10,257 | 7 |
| Trinidad and Tobago | 65 | 571 | 0 | 0 |
| St. Kitts and Nevis | 54 | 42 | 97 | 253 |
| French Polynesia | 54 | 121 | 0 | 0 |
| St. Vincent & the Grenadines | 50 | 53 | 160 | 126 |
| Anguila | 42 | 11 | 45 | 111 |
| Aruba | 31 | 75 | 123 | 661 |
| Andorra | 29 | 7 | 0 | 0 |
| Saint Helena | 22 | 35 | 0 | 0 |
| Montserrat | 20 | 2 | 33 | 70 |
| Monaco | 14 | 6 | 7 | 15 |
| San Marino | 13 | 11 | 58 | 36 |
| Christmas Island | 12 | 0 | 0 | 0 |
| Tonga | 10 | 125 | 0 | 0 |
| Liechtenstein | 9 | 6 | 1 | 8 |
| Gibraltar | 7 | 8 | 6 | 8 |
| Guyana | 0 | 929 | 3,394 | 0 |
| Equatorial Guinea | 0 | 210 | 2,399 | 0 |
| Solomon Islands | 0 | 0 | 1,309 | 0 |
| The Bahamas | 0 | 1,215 | 70 | 0 |
| Brunei | 0 | 0 | 660 | 0 |
| Falkland Island | 0 | 485 | 0 | 0 |
| Vanuatu | 0 | 445 | 0 | 0 |
| Comoros | 0 | 0 | 384 | 0 |
| Samoa | 0 | 342 | 0 | 0 |
| Mayotte | 0 | 0 | 109 | 0 |
| Niue | 0 | 91 | 0 | 0 |
| Turks & Caicos Island | 0 | 9 | 66 | 0 |
| Seychelles | 0 | 32 | 38 | 0 |
| Cook Islands | 0 | 47 | 0 | 0 |
| Wallis & Futura Islands | 0 | 25 | 0 | 0 |
| Palau | 0 | 18 | 0 | 0 |
| American Samoa | 0 | 17 | 0 | 0 |
| French Southern & Antarctic Lands | 0 | 15 | 0 | 0 |
| Bermuda | 0 | 14 | 0 | 0 |
| Norfolk Island | 0 | 10 | 0 | 0 |
In the database, 1.8 million km or more than 50% of the U.S.’s large road map is made up of smaller local roads, giving unparalleled access across almost the entire country. It also has the world’s most secondary roads, while Argentina, India, and Australia lead the rankings with the most tertiary roads.
Regional Differences Between Types of Roads
These different types of roads have a striking effect on the regional visualizations of road maps.
In North America, the U.S. and Canada have a white-yellow hue accounting for the large number of highways, primary, and secondary roads.
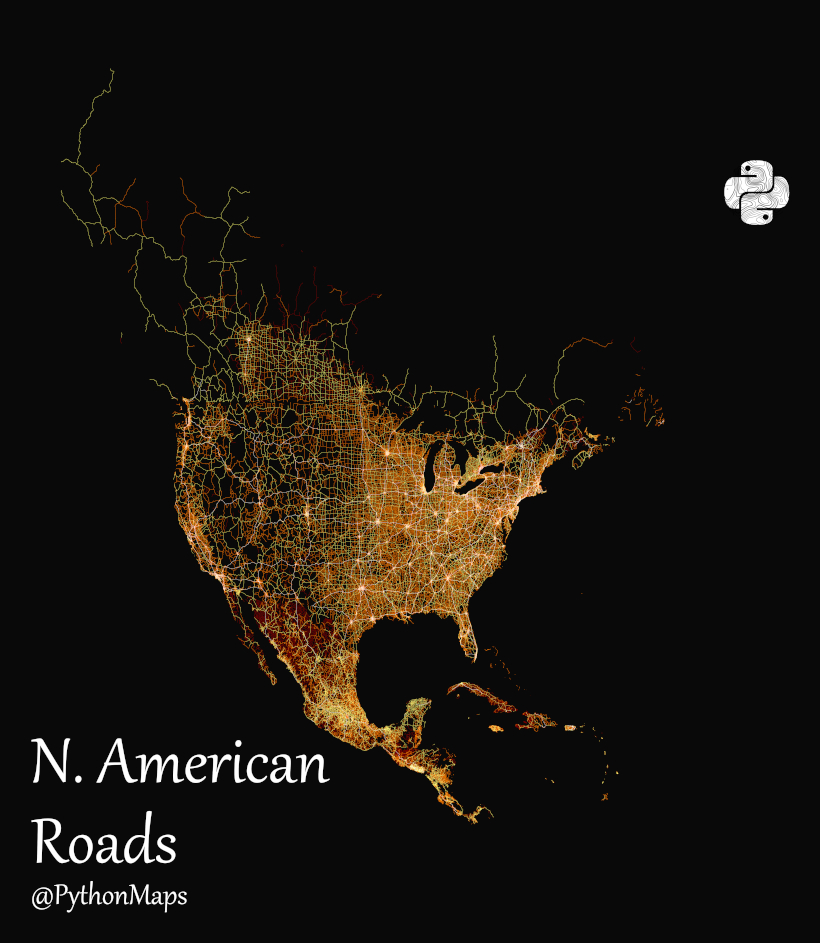
In Mexico, the map takes on a distinct red tint, since tertiary and local roads account for nearly two-thirds of the country’s road network.
Something similar occurs in Europe, where old Cold War divisions play out in white, yellow, and red. France, Germany, Italy, and the U.K. glow hot in a mix of white and yellow, while former Eastern Bloc countries simmer more in red.
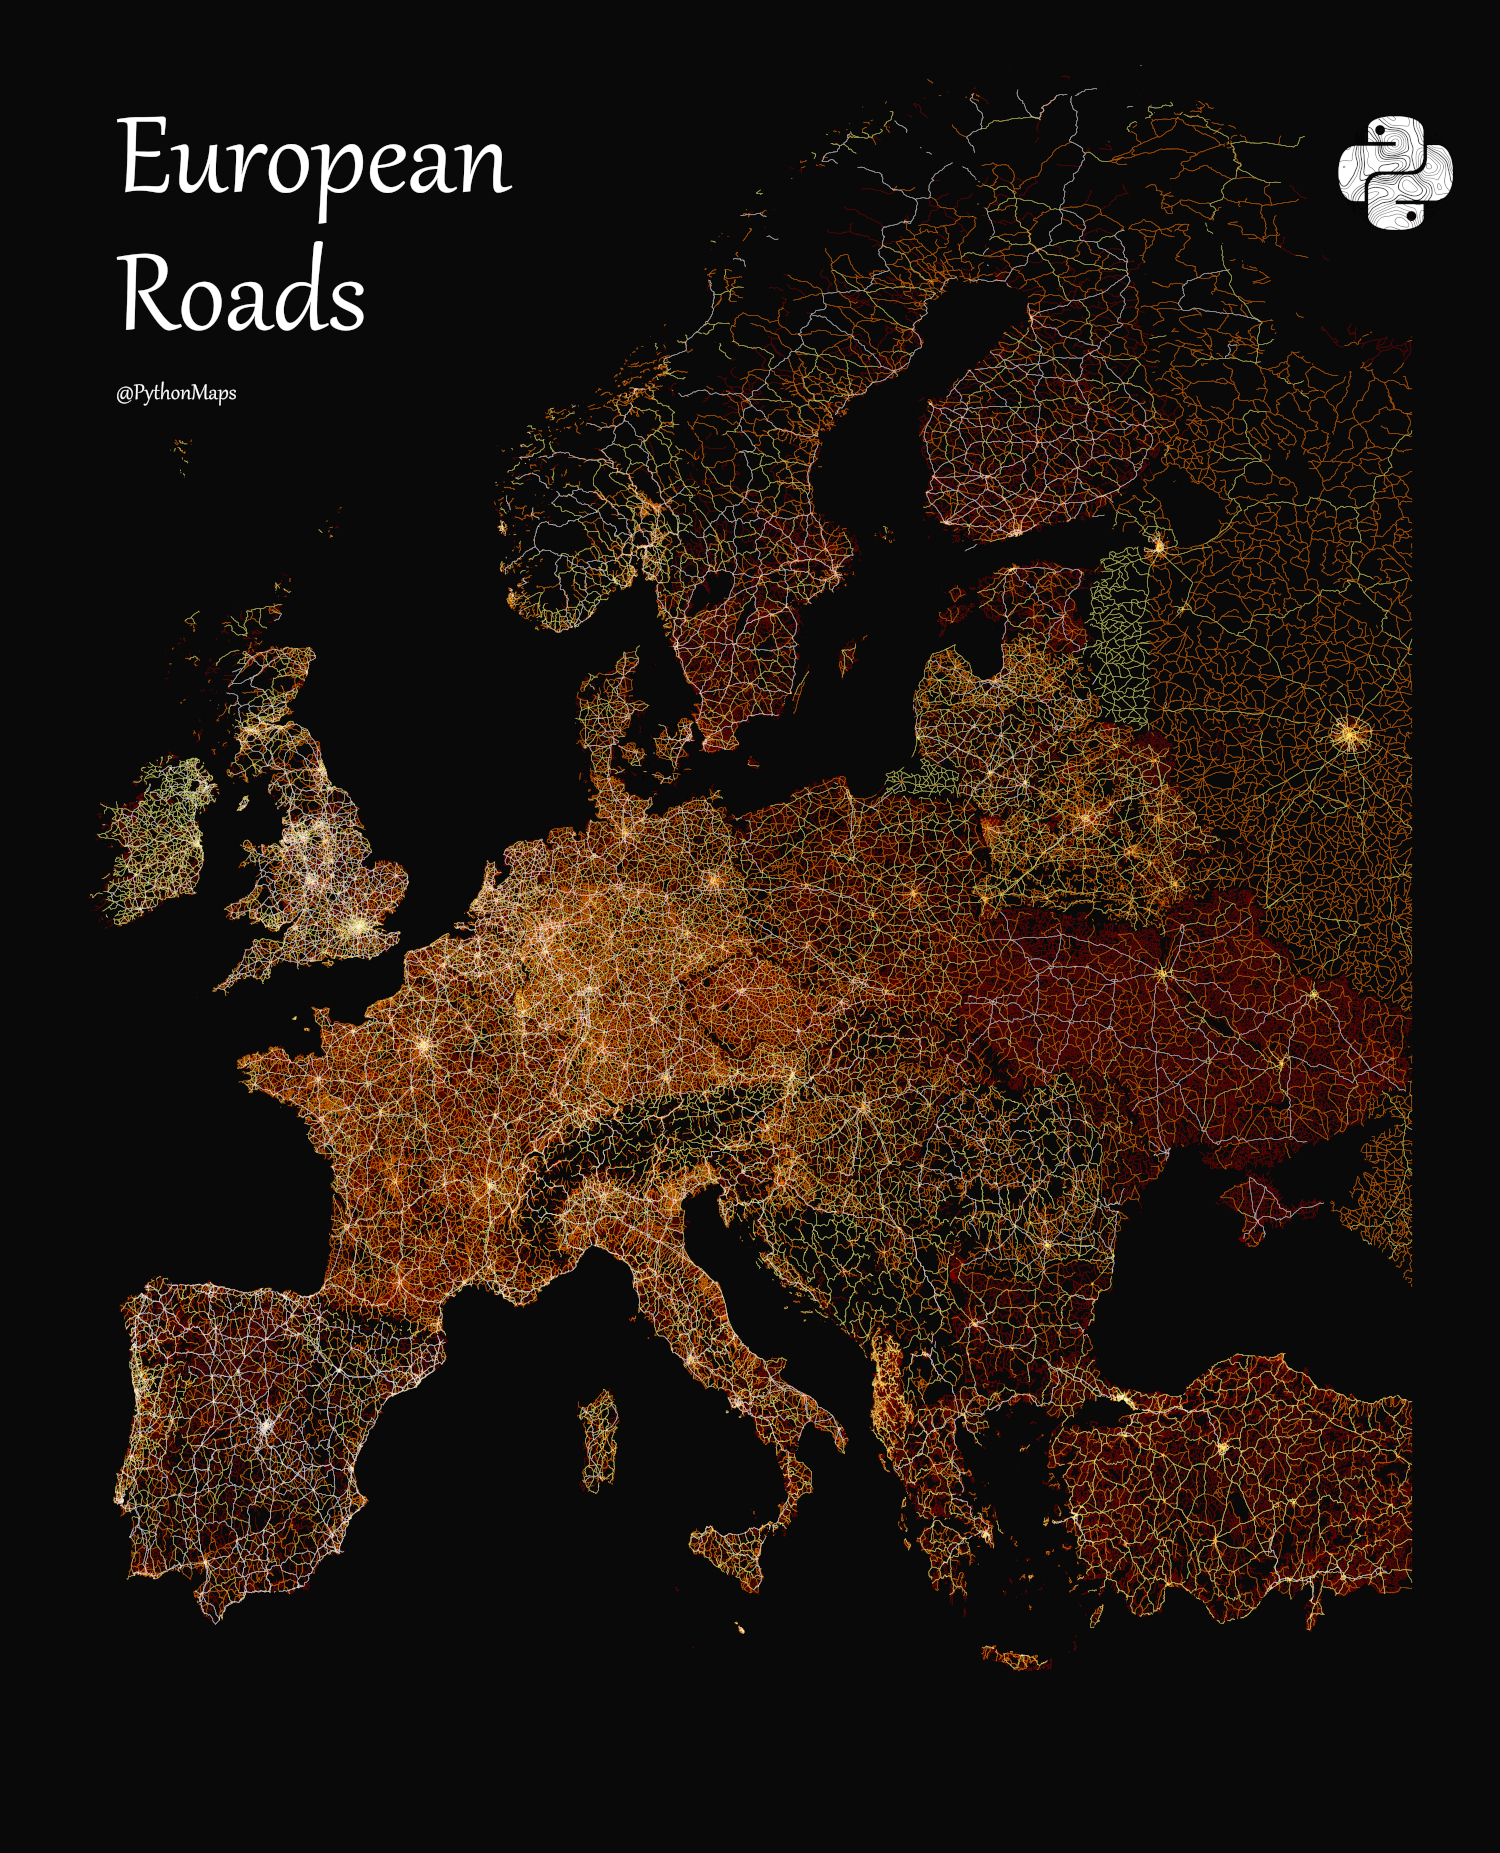
GRIP found that main roads (highways + primary) are usually found in North America, Europe, and China, while the rest of the world has a greater percentage of secondary (yellow) and tertiary and local (red) roads.
However, one interesting sidebar is that the four countries with the greatest percentage of main roads are all from the Middle East.
| Rank (#) | Country | Main Roads (% of All) |
|---|---|---|
| 1 | Bahrain 🇧🇭 | 100% |
| 2 | Kuwait 🇰🇼 | 81% |
| 3 | Bhutan 🇧🇹 | 79% |
| 4 | Qatar 🇶🇦 | 62% |
| 5 | Suriname 🇸🇷 | 54% |
| 6 | U.A.E 🇦🇪 | 46% |
| 7 | Ireland 🇮🇪 | 44% |
| 8 | Singapore 🇸🇬 | 44% |
| 9 | Bosnia 🇧🇦 | 42% |
| 10 | Norway 🇳🇴 | 41% |
| 11 | China 🇨🇳 | 40% |
| 12 | Liechtenstein 🇱🇮 | 38% |
| 13 | Canada 🇨🇦 | 38% |
| 14 | Panama 🇵🇦 | 37% |
| 15 | Grenada 🇬🇩 | 34% |
While there may be reasons for this, it’s possible it could also be a quirk in the database, depending on how data is collected or classified in the region.
What Do Road Networks Tell Us About Countries?
Analysis of the GRIP database found that “total road length in a country is strongly and positively related to its total land surface area, human population density, gross domestic product, and OECD membership.”
However, of all the correlations, population density is perhaps the most visible in snapshots of the larger world map, such as in this one of Asia.
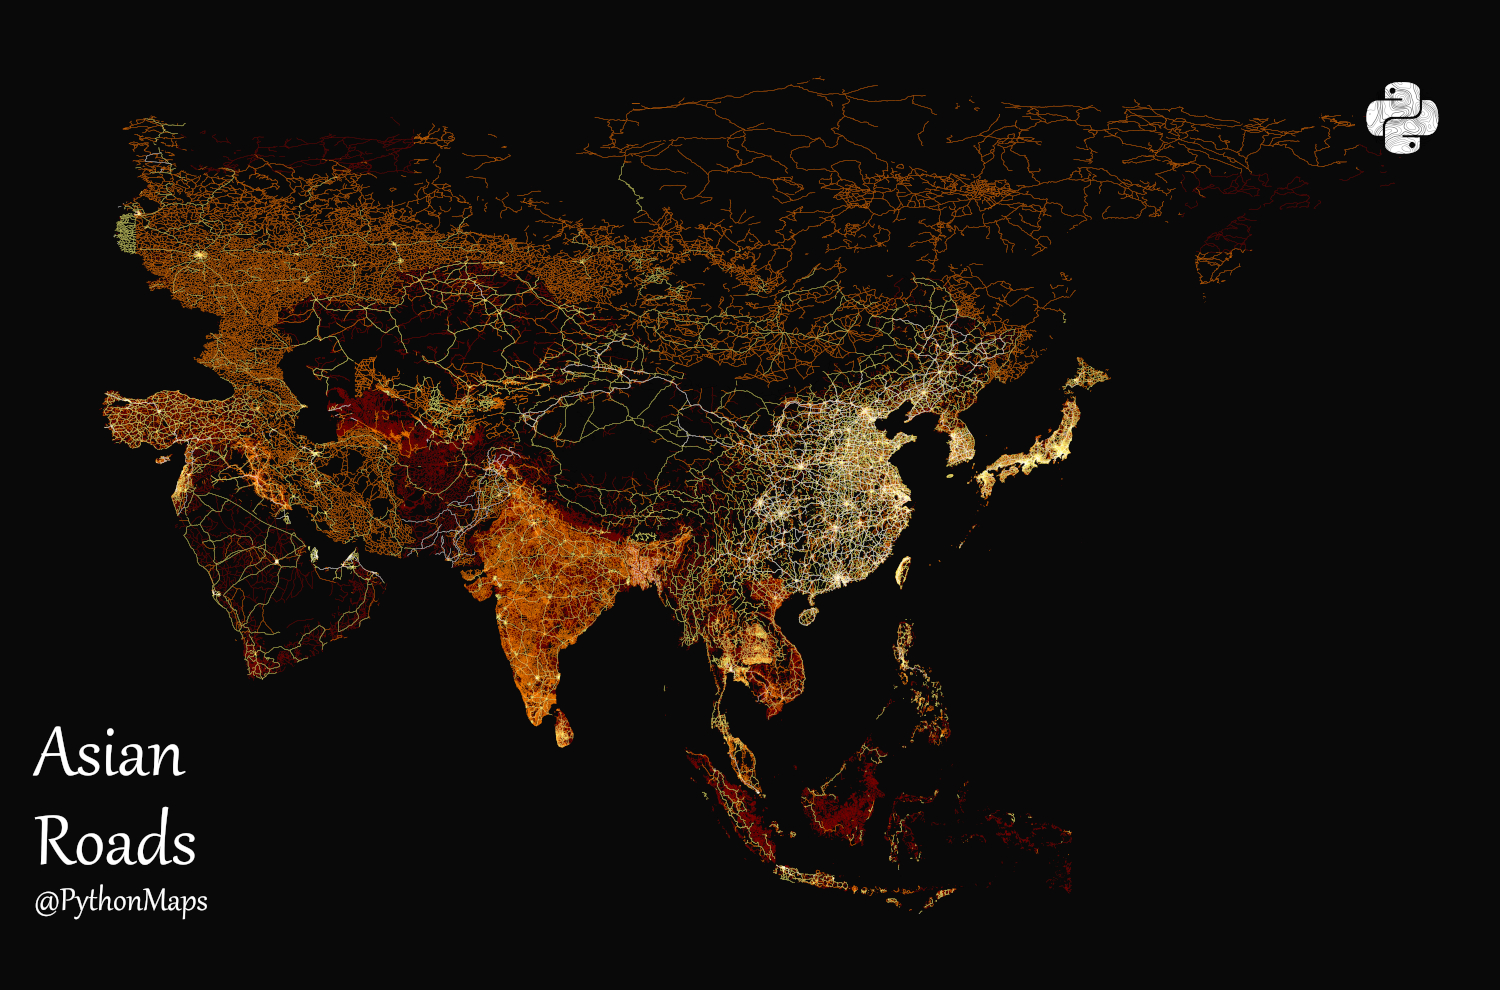
The Indian subcontinent and Eastern China are the two most populous regions of the world, accounting for nearly 35% of the world’s population. The most populous regions within—especially in China—have more roads, representing growing cities and urban centers.
The opposite is visible in Africa and Australia, where large natural features like deserts prevent human settlement and roads vanish from the visualization as well.
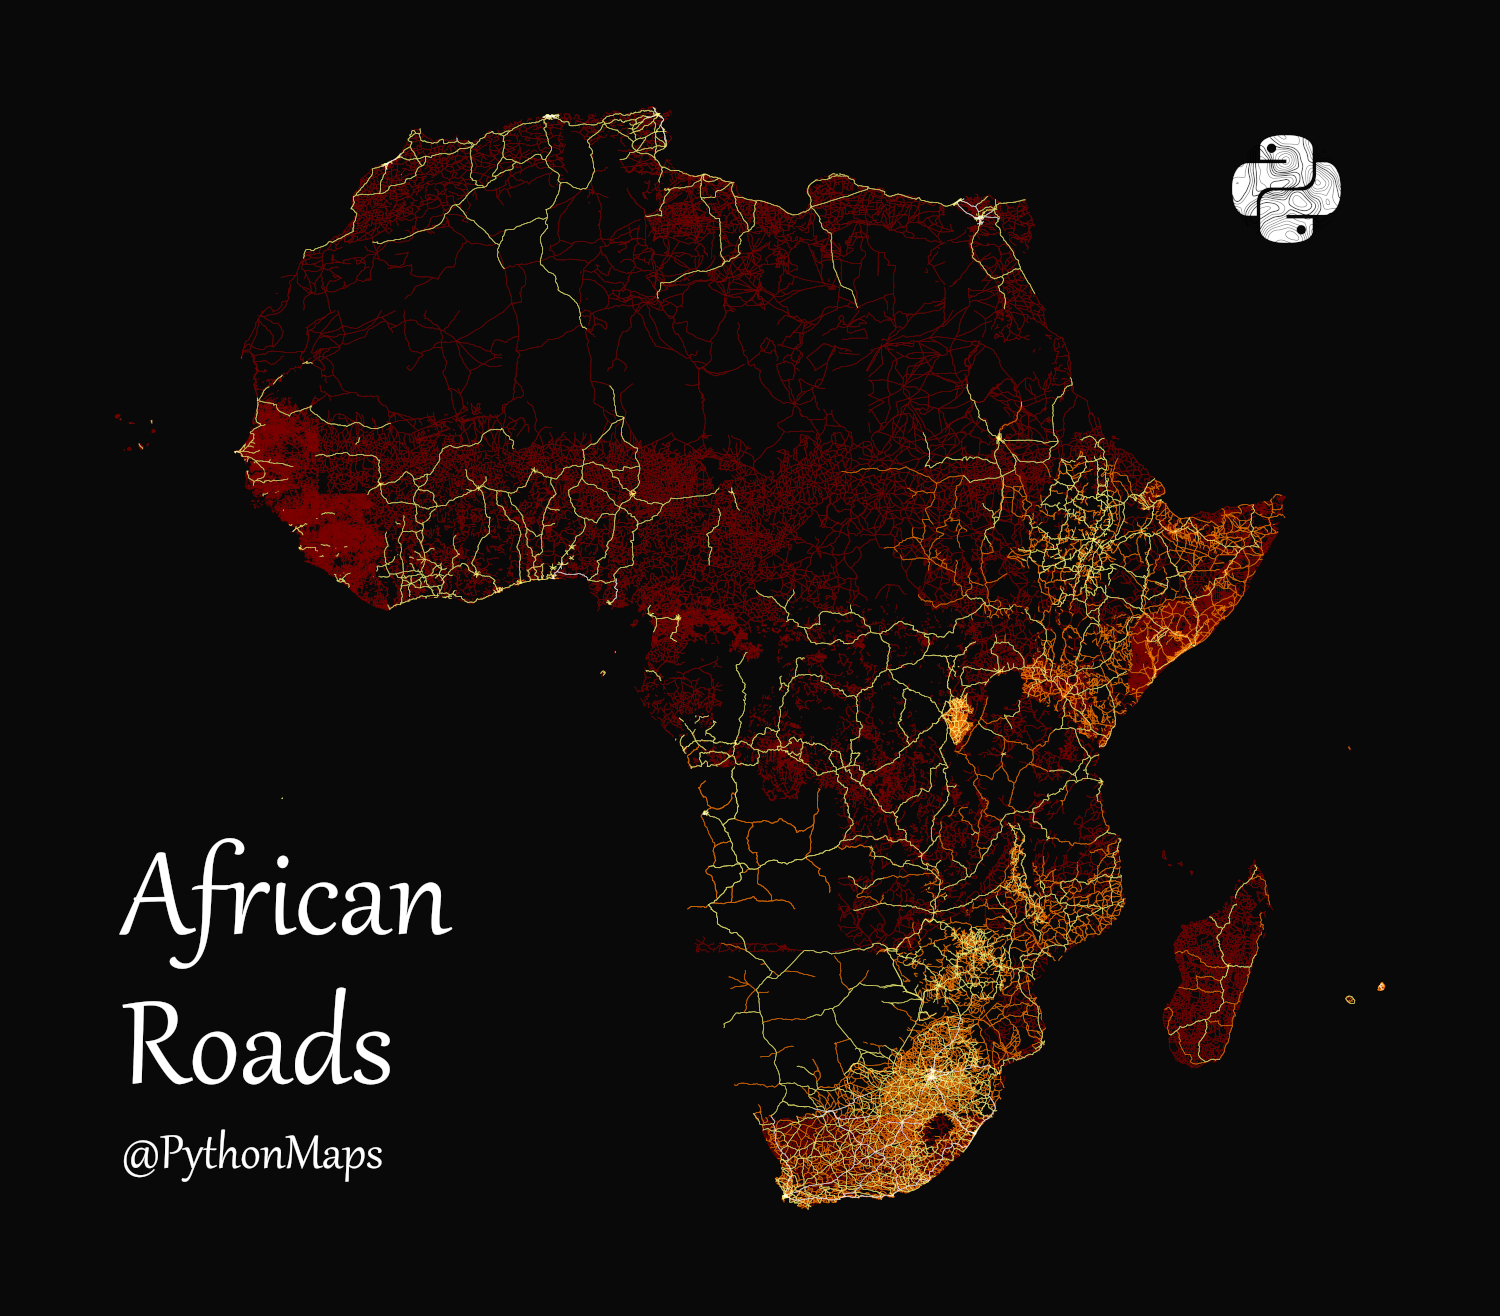
Road Maps and Sustainable Development
The environmental impact of economic development is also visual on these road networks.
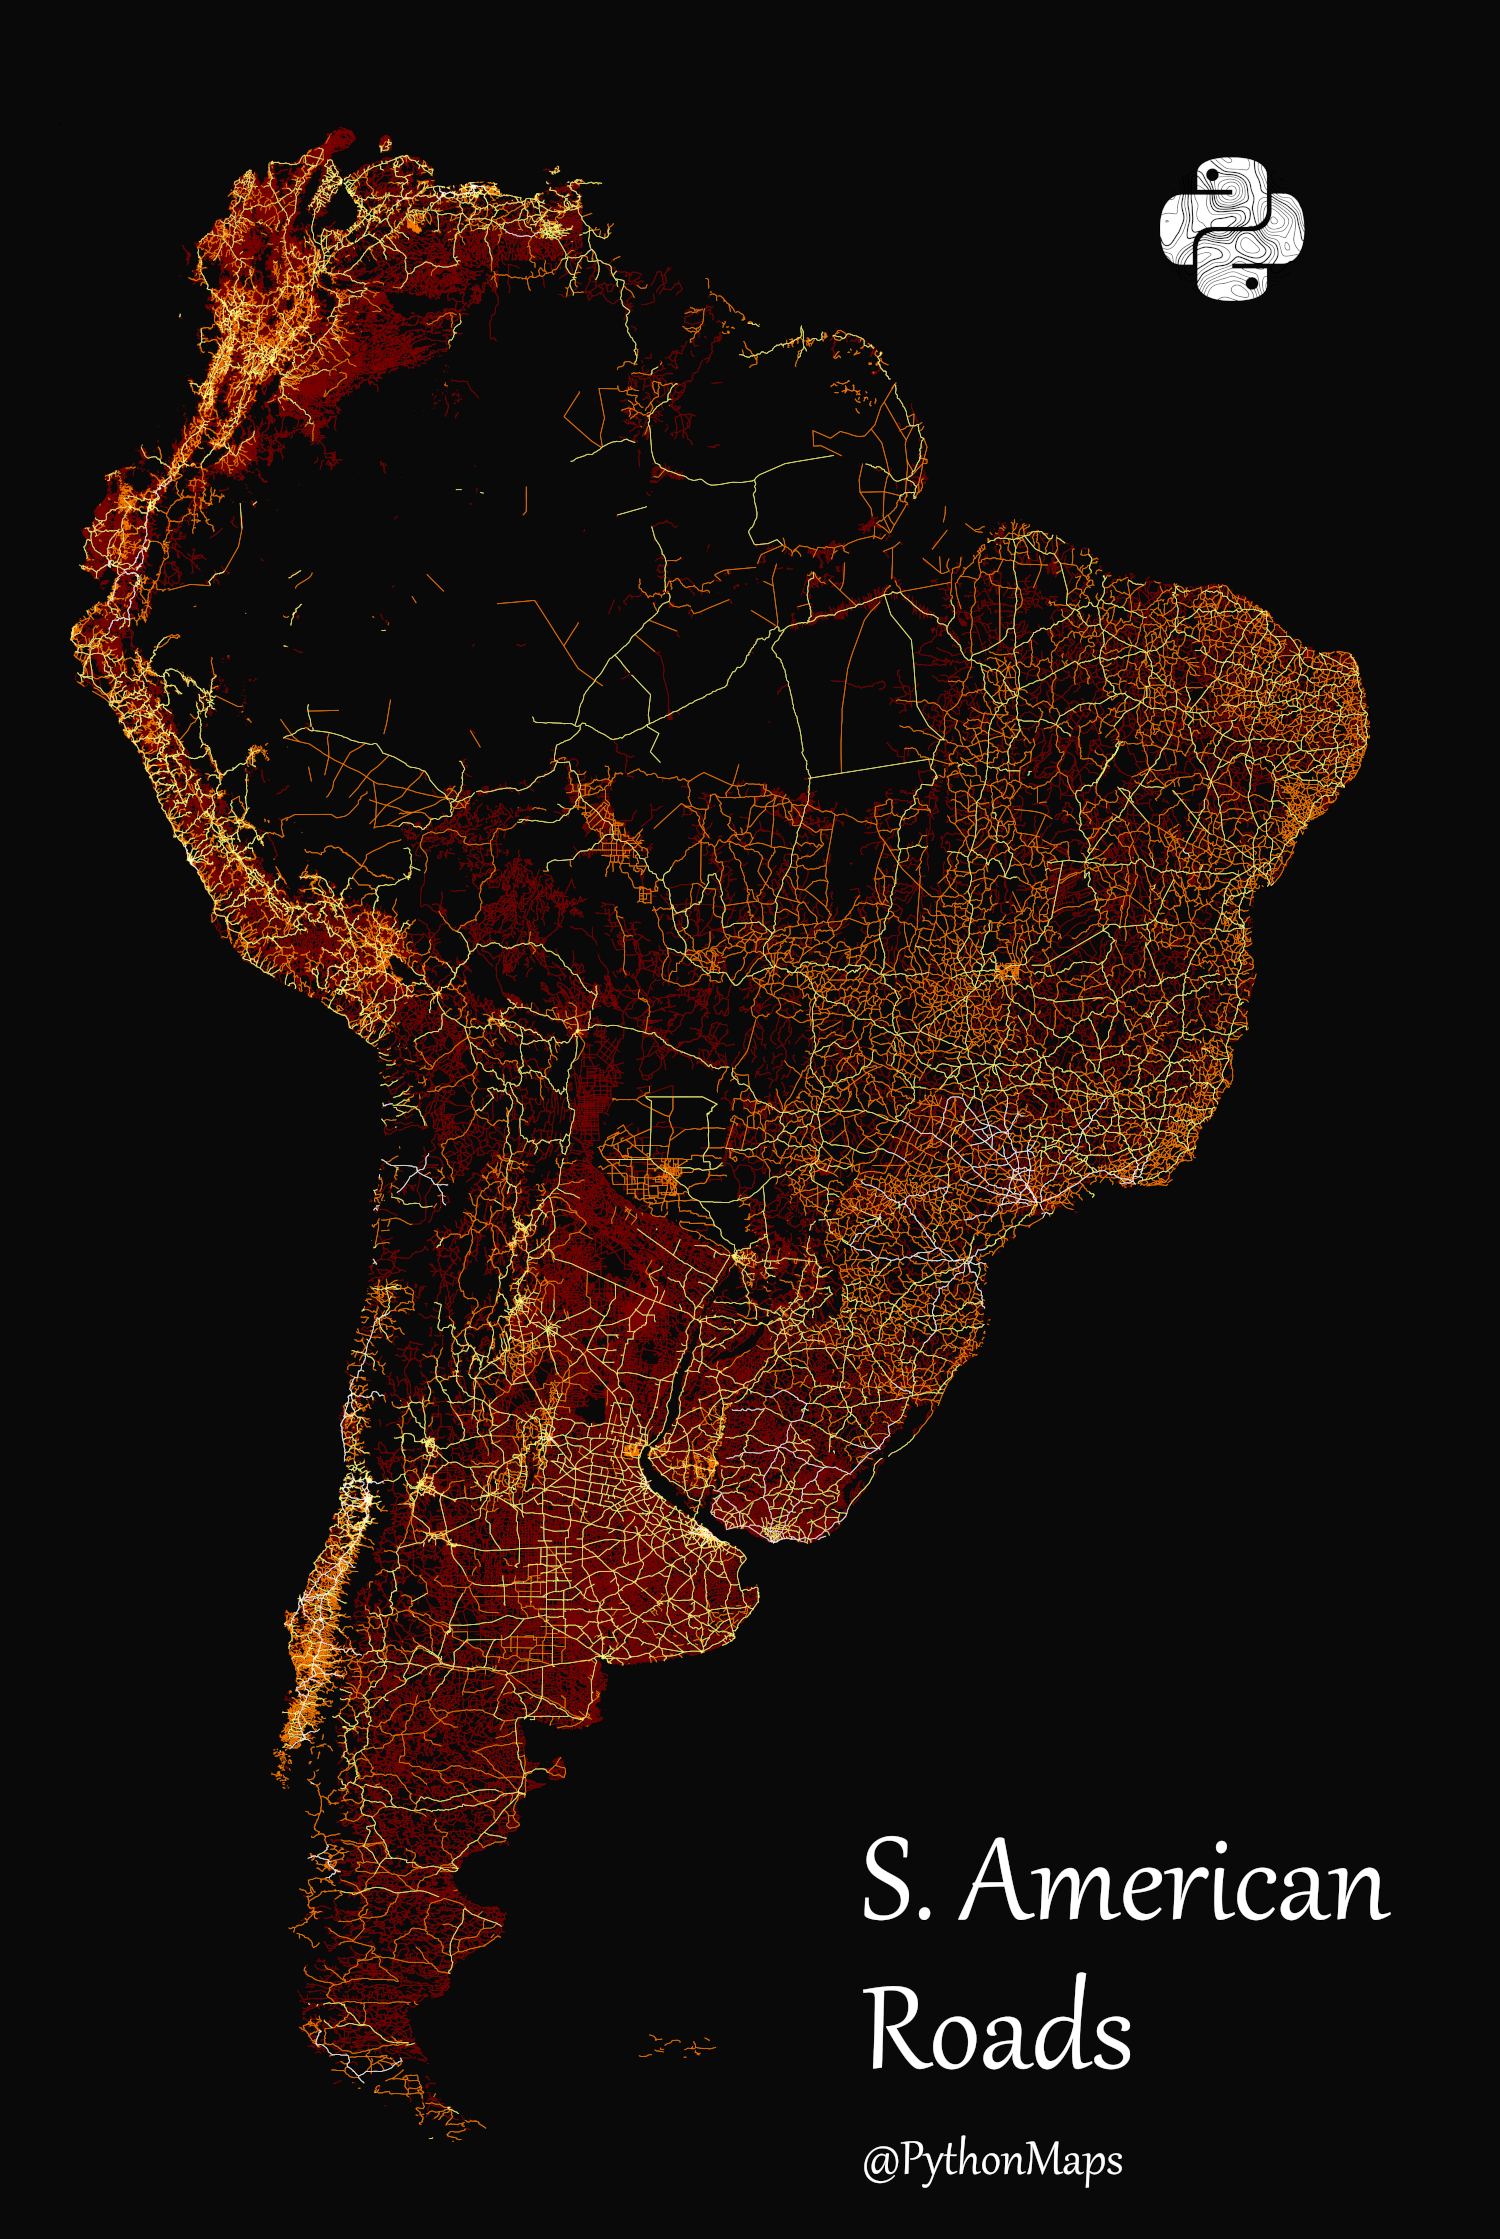
Road construction leads to emissions and biodiversity displacement. By matching road maps with natural environment visualizations like this forest map, we can see how much of the world’s pristine natural reserves are still untouched by humankind.
In South America for example, the Amazon rainforest accounts for a large chunk of Brazil’s lacking road coverage.
Finally, though the GRIP research attributes population and affluence as key correlations with road development, other economic factors drive road network expansion as well.
The researchers estimate that there will be 4 million kilometers of additional roads covering the Earth by 2050, even under conservative assumptions.
In the never-ending balancing act of sustainable development and economic prosperity, development of the world’s road map will have ripple effects for years to come.

This article was published as a part of Visual Capitalist's Creator Program, which features data-driven visuals from some of our favorite Creators around the world.


population
Vintage Viz: World Cities With 1 Million Residents (1800–1930)
From someone born in the 19th century, in the midst of historic population growth, comes this vintage visualization showing world cities growing ever bigger.
World Cities With At Least 1 Million Residents (1800–1930)
This chart is the latest in our Vintage Viz series, which presents historical visualizations along with the context needed to understand them.
The explosive world population boom in the last 300 years is common knowledge today. Much and more has been written about how and why it happened, why it was unusual, and how the specter of a declining population for the first time in three centuries could impact human society.
However, equally compelling, is how people in the past—those living in the midst of the early waves of this boom—were fascinated by what they were witnessing.
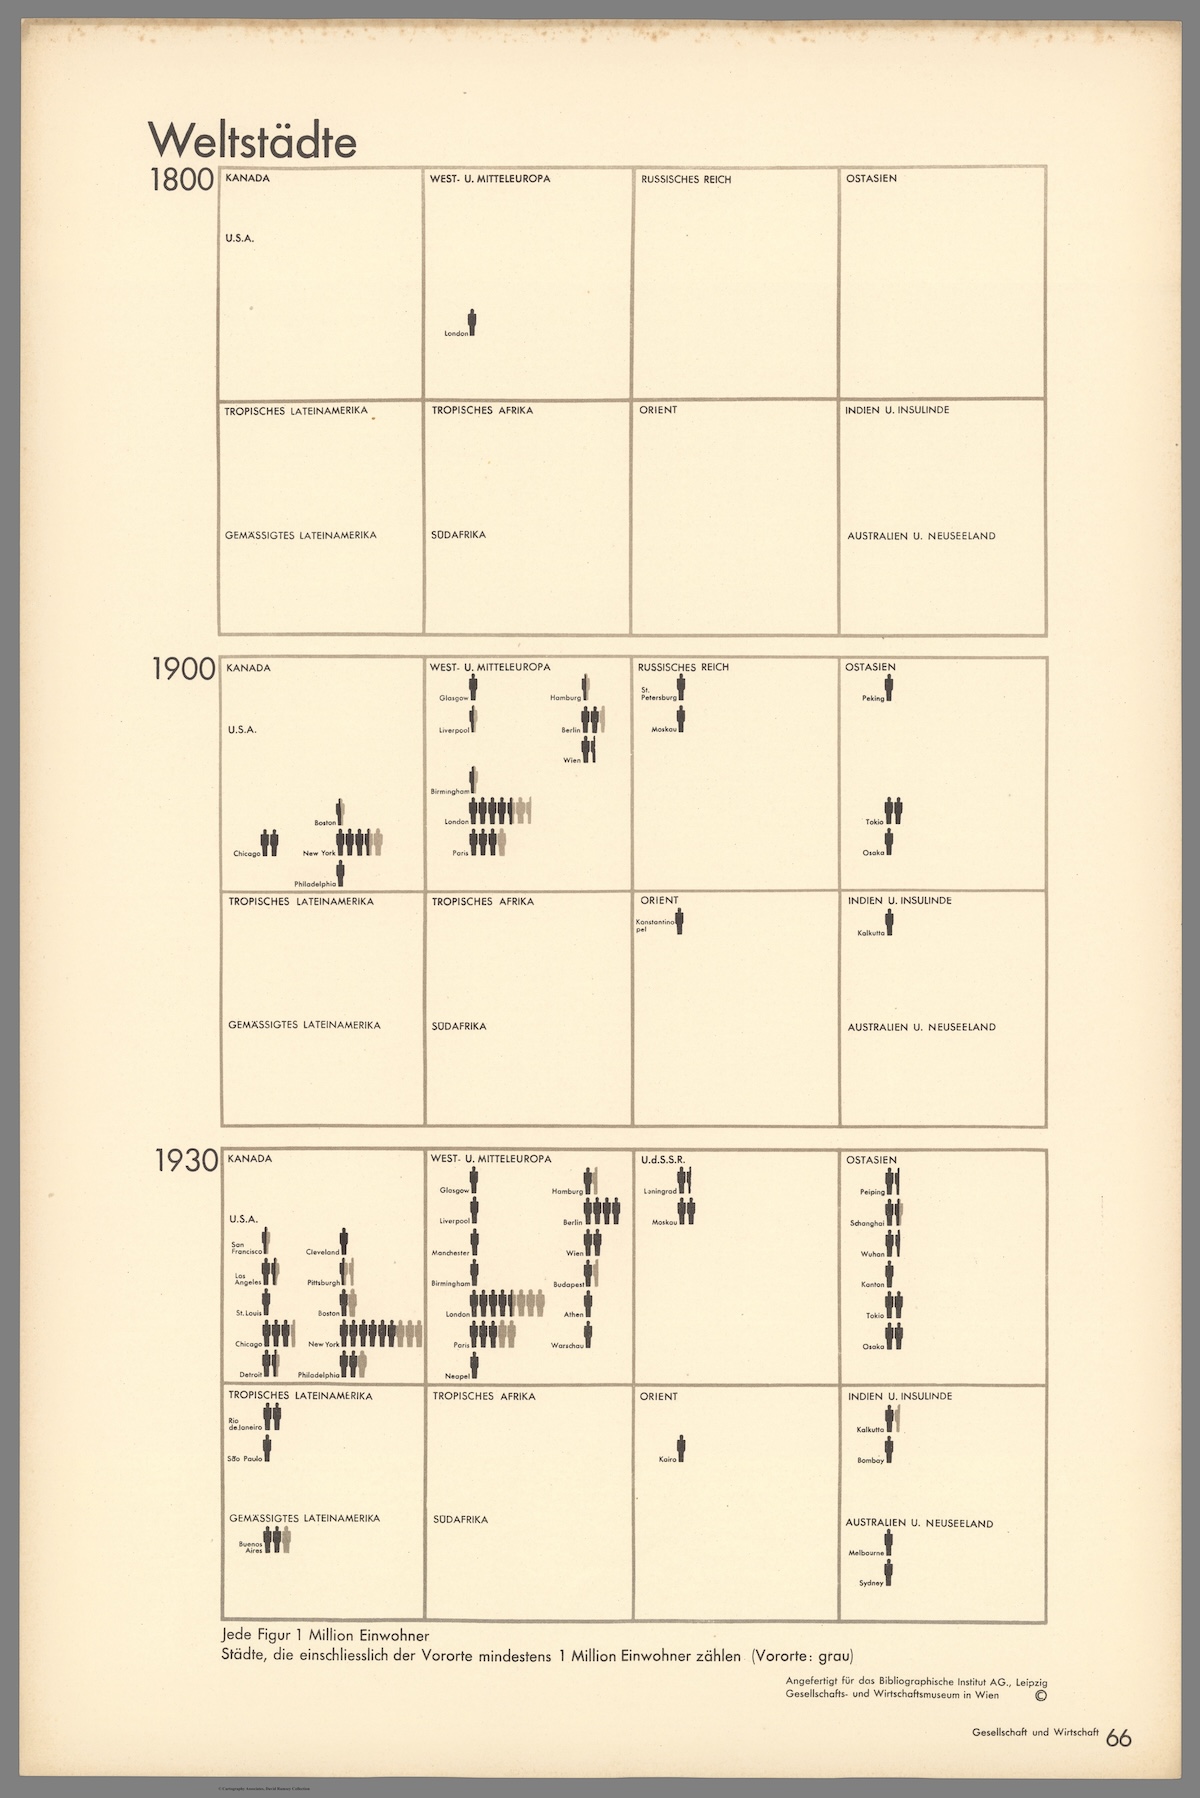
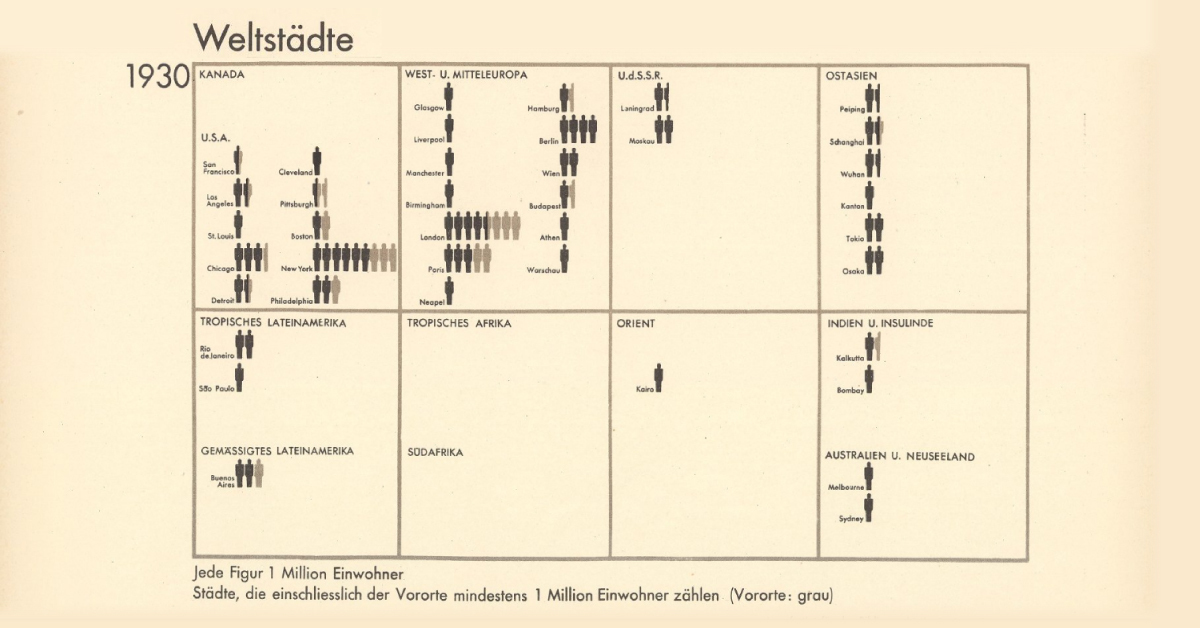
Evidence of this comes from today’s vintage visualization, denoting the increasing number of world cities with at least one million inhabitants through the years.
The above pictogram was made by Austrian philosopher and sociologist Otto Neurath (1882–1945), found in his book, Society and Economy, published in 1930.
World Population Doubles Between 1800 and 1930
In 1800, the world population crossed 1 billion for the first time ever.
In the next 130 years, it doubled past 2 billion.
The Second Agricultural Revolution, characterized by massive land and labor productivity, grew agricultural output more than the population and is one of the key drivers of this population growth.
And in the pictogram above, where one silhouette indicates one million inhabitants, this exponential population growth becomes far more vivid.
In 1800, for example, according to the creator’s estimates, only London had at least million residents. A century later, 15 cities now boasted of the same number. Then, three decades hence, 37 cities across the world had one million inhabitants.
| Year | Cities with One Million Residents |
|---|---|
| 1800 | 1 |
| 1900 | 15 |
| 1930 | 37 |
Importantly, the data above is based on the creator’s estimates from a century ago, and does not include Beijing (then referred to as Peking in English) in 1800. Historians now agree that the city had more than a million residents, and was the largest city in the world at the time.
Another phenomenon becoming increasingly apparent is growing urbanization—food surplus frees up large sections of the population from agriculture, driving specialization in other skills and trade, in turn leading to congregations in urban centers.
Other visualizations in the same book covered migration, Indigenous peoples, labor, religion, trade, and natural resources, reflecting the creator’s interest in the social life of individuals and their well-being.
Who Was Otto Neurath and What is His Legacy?
This vintage visualization might seem incredibly simple, simplistic even, considering how we map out population data today. But the creator Otto Neurath, and his wife Marie, were pioneers in the field of visual communication.
One of their notable achievements was the creation of the Vienna Method of pictorial statistics, which aimed to represent statistical information in a visually accessible way—the forerunner to modern-day infographics.
The Neuraths believed in using clear and simple visual language to convey complex information to a broad audience, an approach that laid the foundation for modern information design.
They fled Austria during the rise of the Nazi regime and spent their later years in various countries, including the UK. Otto Neurath’s influence on graphic design, visual communication, and the philosophy of language has endured, and his legacy is still recognized in these fields today.

-

 Economy7 days ago
Ranked: The Top 20 Countries in Debt to China
-

 Demographics2 weeks ago
The Countries That Have Become Sadder Since 2010
-

 Money2 weeks ago
Charted: Who Has Savings in This Economy?
-

 Technology2 weeks ago
Visualizing AI Patents by Country
-

 Economy2 weeks ago
Economic Growth Forecasts for G7 and BRICS Countries in 2024
-

 Wealth2 weeks ago
Charted: Which City Has the Most Billionaires in 2024?
-

 Technology1 week ago
All of the Grants Given by the U.S. CHIPS Act
-

 Green1 week ago
The Carbon Footprint of Major Travel Methods