Countries
Charted: The Number of Democracies Globally
Article/Editing:
Charted: The Number of Democracies Globally
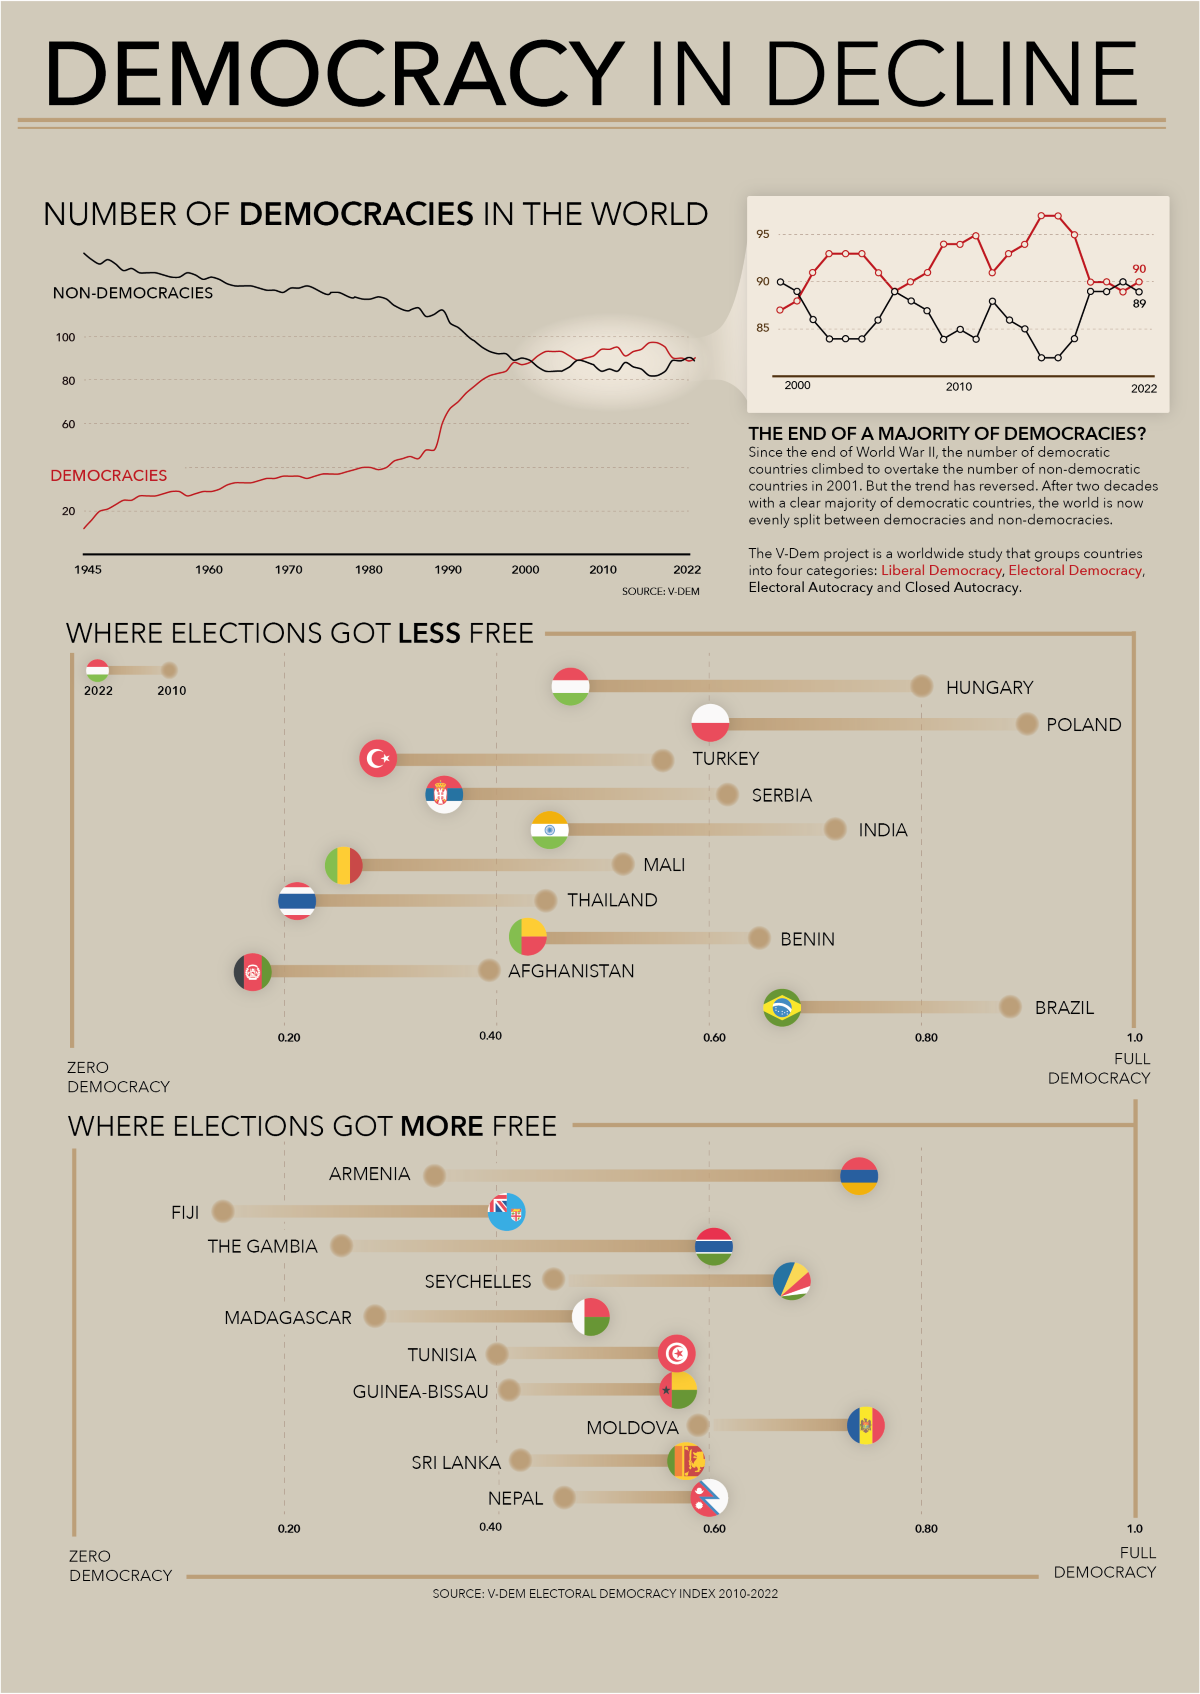
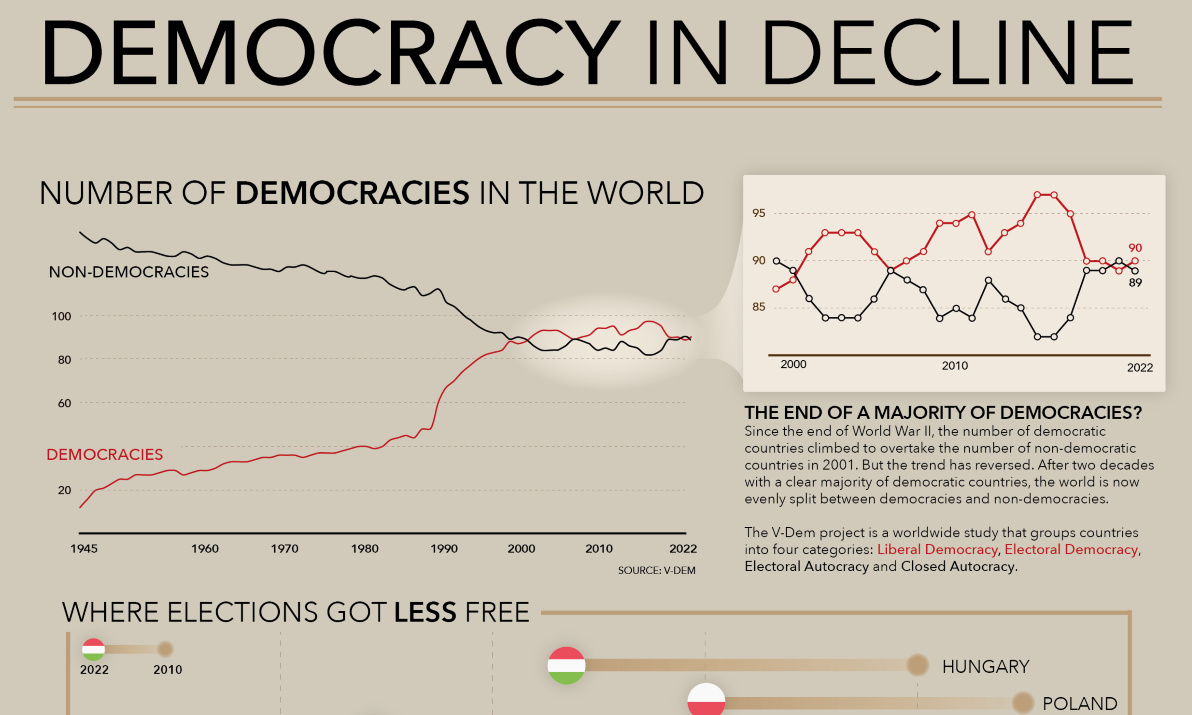
The end of World War II in 1945 was a turning point for democracies around the world.
Before this critical turning point in geopolitics, democracies made up only a small number of the world’s countries, both legally and in practice. However, over the course of the next six decades, the number of democratic nations would more than quadruple.
Interestingly, studies have found that this trend has recently reversed as of the 2010s, with democracies and non-democracies now in a deadlock.
In this visualization, Staffan Landin uses data from V-DEM’s Electoral Democratic Index (EDI) to highlight the changing face of global politics over the past two decades and the nations that contributed the most to this change.
The Methodology
V-DEM’s EDI attempts to measure democratic development in a comprehensive way, through the contributions of 3,700 experts from countries around the world.
Instead of relying on each nation’s legally recognized system of government, the EDI analyzes the level of electoral democracy in countries on a range of indicators, including:
- Free and fair elections
- Rule of law
- Alternative sources of information and association
- Freedom of expression
Countries are assigned a score on a scale from 0 to 1, with higher scores indicating a higher level of democracy. Each is also categorized into four types of functional government, from liberal and electoral democracies to electoral and closed autocracies.
Which Countries Have Declined the Most?
The EDI found that numerous countries around the world saw declines in democracy over the past two decades. Here are the 10 countries that saw the steepest decline in EDI score since 2010:
| Country | Democracy Index (2010) | Democracy Index (2022) | Points Lost |
|---|---|---|---|
| 🇭🇺 Hungary | 0.80 | 0.46 | -34 |
| 🇵🇱 Poland | 0.89 | 0.59 | -30 |
| 🇷🇸 Serbia | 0.61 | 0.34 | -27 |
| 🇹🇷 Türkiye | 0.55 | 0.28 | -27 |
| 🇮🇳 India | 0.71 | 0.44 | -27 |
| 🇲🇱 Mali | 0.51 | 0.25 | -26 |
| 🇹🇭 Thailand | 0.44 | 0.20 | -24 |
| 🇦🇫 Afghanistan | 0.38 | 0.16 | -22 |
| 🇧🇷 Brazil | 0.88 | 0.66 | -22 |
| 🇧🇯 Benin | 0.64 | 0.42 | -22 |
Central and Eastern Europe was home to three of the countries seeing the largest declines in democracy. Hungary, Poland, and Serbia lead the table, with Hungary and Serbia in particular dropping below scores of 0.5.
Some of the world’s largest countries by population also decreased significantly, including India and Brazil. Across most of the top 10, the “freedom of expression” indicator was hit particularly hard, with notable increases in media censorship to be found in Afghanistan and Brazil.
Countries Becoming More Democratic
Here are the 10 countries that saw the largest increase in EDI score since 2010:
| Country | Democracy Index (2010) | Democracy Index (2022) | Points Gained |
|---|---|---|---|
| 🇦🇲 Armenia | 0.34 | 0.74 | +40 |
| 🇫🇯 Fiji | 0.14 | 0.40 | +26 |
| 🇬🇲 The Gambia | 0.25 | 0.50 | +25 |
| 🇸🇨 Seychelles | 0.45 | 0.67 | +22 |
| 🇲🇬 Madagascar | 0.28 | 0.48 | +20 |
| 🇹🇳 Tunisia | 0.40 | 0.56 | +16 |
| 🇱🇰 Sri Lanka | 0.42 | 0.57 | +15 |
| 🇬🇼 Guinea-Bissau | 0.41 | 0.56 | +15 |
| 🇲🇩 Moldova | 0.59 | 0.74 | +15 |
| 🇳🇵 Nepal | 0.46 | 0.59 | +13 |
Armenia, Fiji, and Seychelles saw significant improvement in the autonomy of their electoral management bodies in the last 10 years. Partially as a result, both Armenia and Seychelles have seen their scores rise above 0.5.
The Gambia also saw great improvement across many election indicators, including the quality of voter registries, vote buying, and election violence. It was one of five African countries to make the top 10 most improved democracies.
With the total number of democracies and non-democracies almost tied over the past four years, it is hard to predict the political atmosphere in the future.

This article was published as a part of Visual Capitalist's Creator Program, which features data-driven visuals from some of our favorite Creators around the world.


Demographics
Countries With the Largest Happiness Gains Since 2010
Tracking Gallup survey data for more than a decade reveals insights into the regions seeing happiness gains.
Countries With the Largest Happiness Gains Since 2010
This was originally posted on our Voronoi app. Download the app for free on iOS or Android and discover incredible data-driven charts from a variety of trusted sources.
In 2011, Bhutan sponsored a UN resolution that invited governments to prioritize happiness and well-being as a way to measure social and economic development.
And thus, the World Happiness Report was born.
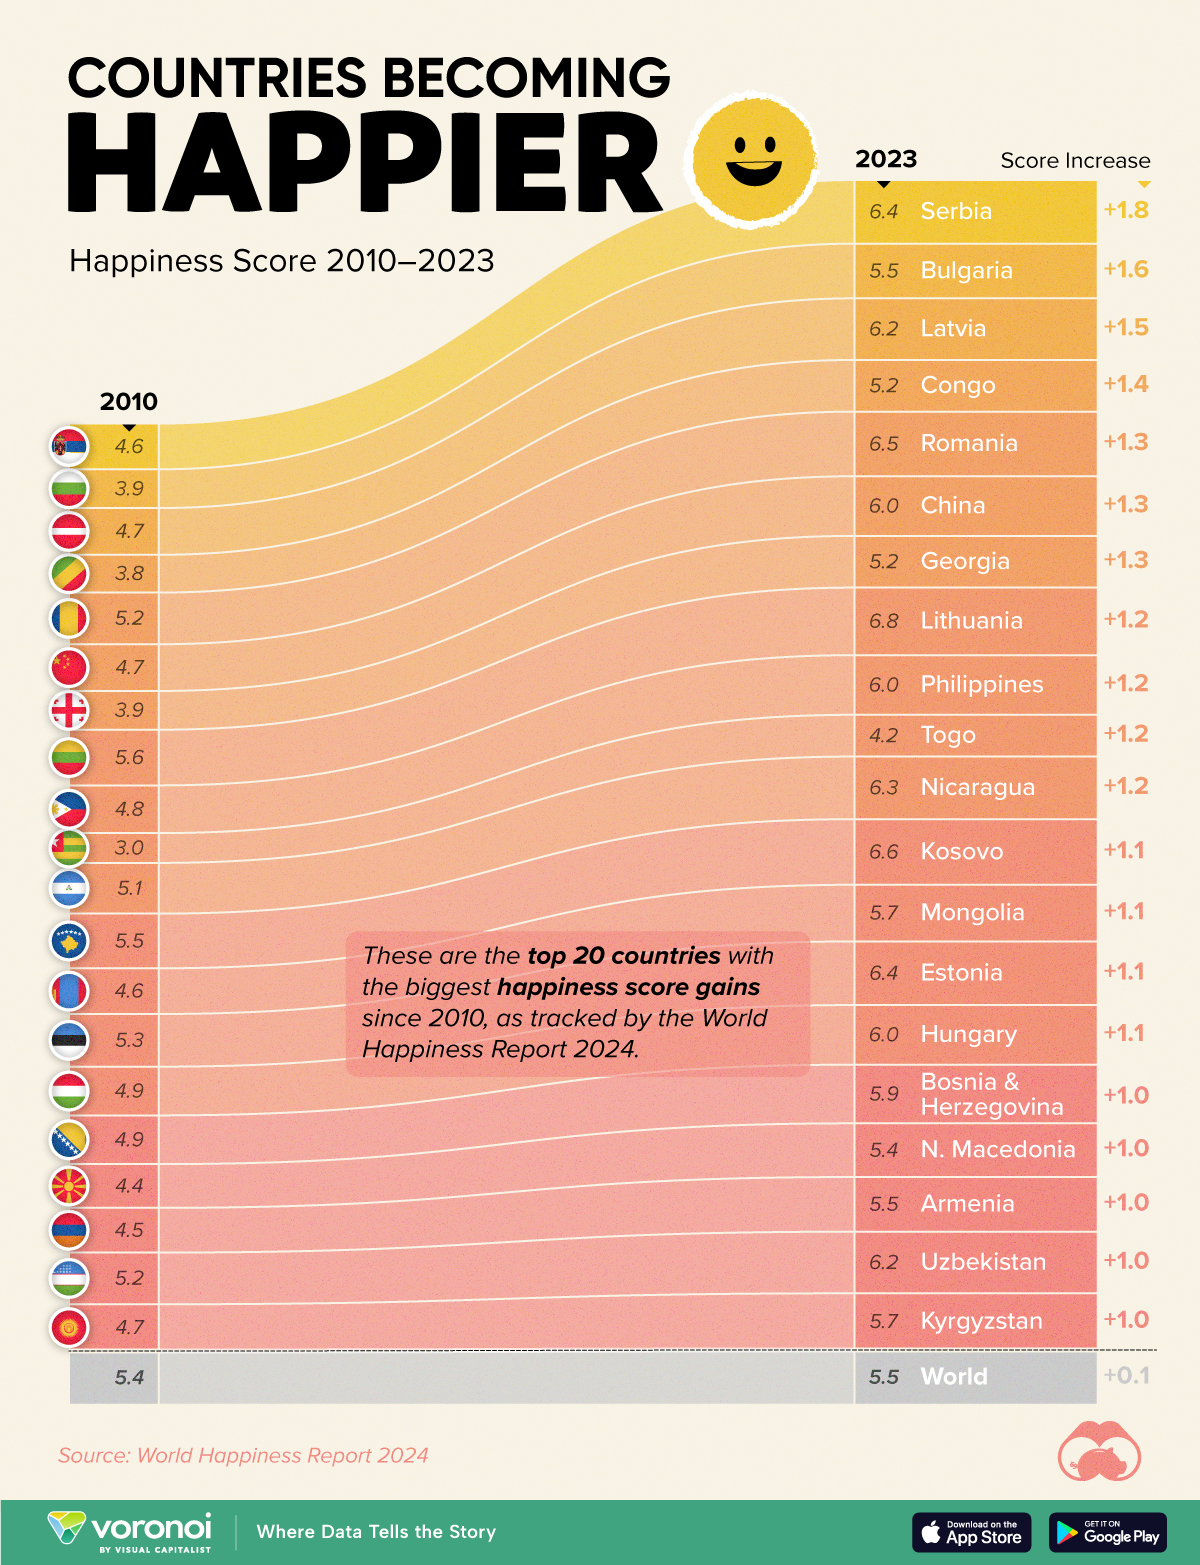
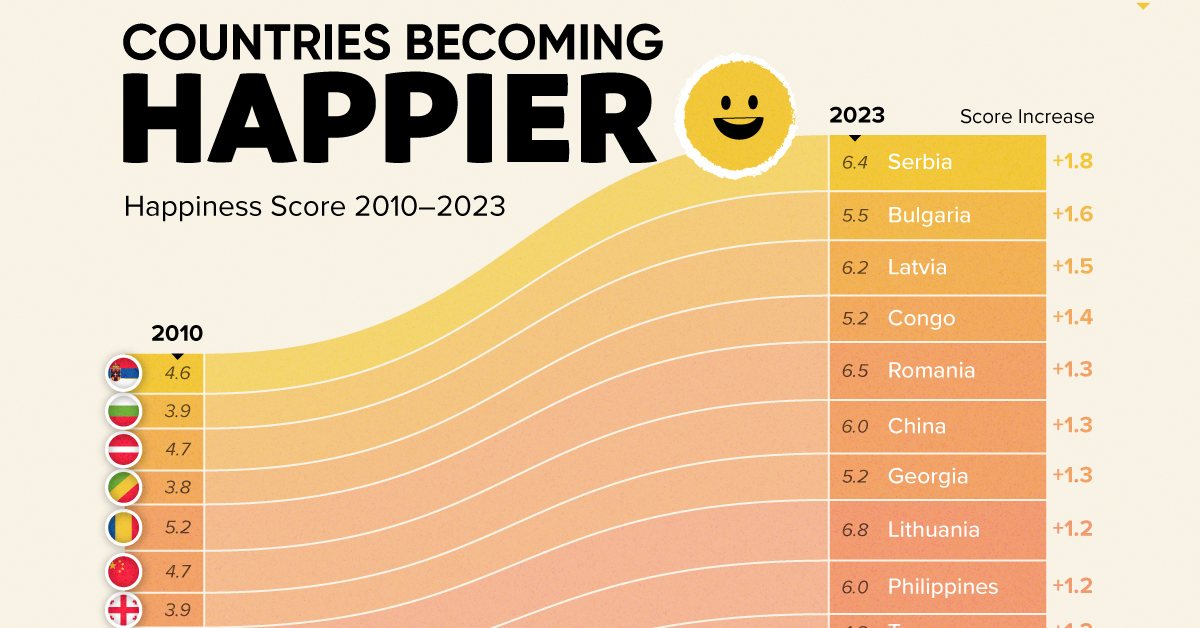
In 2012, the first report released, examining Gallup poll data from 2006–2010 that asked respondents in nearly every country to evaluate their life on a 0–10 scale. From this they extrapolated a single “happiness score” out of 10 to compare how happy countries are.
More than a decade later, the 2024 World Happiness Report continues the mission to quantify, measure, and compare well-being. Its latest findings also include how countries have become happier in the intervening years.
We visualize these findings in the above chart, which shows the 20 countries that have seen their happiness scores grow the most since 2010.
Which Countries Have Become Happier Since 2010?
Serbia leads a list of 12 Eastern European nations whose average happiness score has improved more than 20% in the last decade.
In the same time period, the Serbian economy has doubled to $80 billion, and its per capita GDP has nearly doubled to $9,538 in current dollar terms.
| Rank | Country | Happiness Score Gains (2010–2024) | 2024 Happiness Score (out of 10) |
|---|---|---|---|
| 1 | 🇷🇸 Serbia | +1.8 | 6.4 |
| 2 | 🇧🇬 Bulgaria | +1.6 | 5.5 |
| 3 | 🇱🇻 Latvia | +1.5 | 6.2 |
| 4 | 🇨🇬 Congo | +1.4 | 5.2 |
| 5 | 🇷🇴 Romania | +1.3 | 6.5 |
| 6 | 🇨🇳 China | +1.3 | 6.0 |
| 7 | 🇬🇪 Georgia | +1.3 | 5.2 |
| 8 | 🇱🇹 Lithuania | +1.2 | 6.8 |
| 9 | 🇵🇭 Philippines | +1.2 | 6.0 |
| 10 | 🇹🇬 Togo | +1.2 | 4.2 |
| 11 | 🇳🇮 Nicaragua | +1.2 | 6.3 |
| 12 | 🇽🇰 Kosovo | +1.1 | 6.6 |
| 13 | 🇲🇳 Mongolia | +1.1 | 5.7 |
| 14 | 🇪🇪 Estonia | +1.1 | 6.4 |
| 15 | 🇭🇺 Hungary | +1.1 | 6.0 |
| 16 | 🇧🇦 Bosnia & Herzegovina | +1.0 | 5.9 |
| 17 | 🇲🇰 North Macedonia | +1.0 | 5.4 |
| 18 | 🇦🇲 Armenia | +1.0 | 5.5 |
| 19 | 🇺🇿 Uzbekistan | +1.0 | 6.2 |
| 20 | 🇰🇬 Kyrgyzstan | +1.0 | 5.7 |
| N/A | 🌍 World | +0.1 | 5.5 |
Since the first report, Western Europe has on average been happier than Eastern Europe. But as seen with these happiness gains, Eastern Europe is now seeing their happiness levels converge closer to their Western counterparts. In fact, when looking at those under the age of 30, the most recent happiness scores are nearly the same across the continent.
All in all, 20 countries have increased their happiness score by a full point or more since 2010, on the 0–10 scale.

-

 Mining1 week ago
Gold vs. S&P 500: Which Has Grown More Over Five Years?
-

 Markets2 weeks ago
Ranked: The Most Valuable Housing Markets in America
-

 Money2 weeks ago
Which States Have the Highest Minimum Wage in America?
-

 AI2 weeks ago
Ranked: Semiconductor Companies by Industry Revenue Share
-

 Markets2 weeks ago
Ranked: The World’s Top Flight Routes, by Revenue
-

 Countries2 weeks ago
Population Projections: The World’s 6 Largest Countries in 2075
-

 Markets2 weeks ago
The Top 10 States by Real GDP Growth in 2023
-

 Demographics2 weeks ago
The Smallest Gender Wage Gaps in OECD Countries