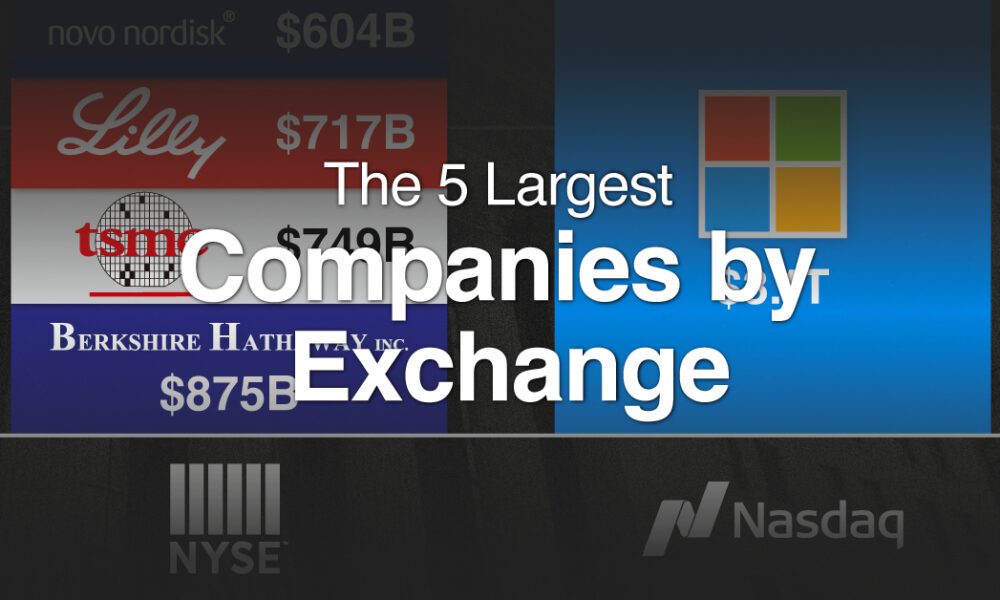
With trillion dollar valuations becoming more common, we've compared the five biggest companies by stock exchange.
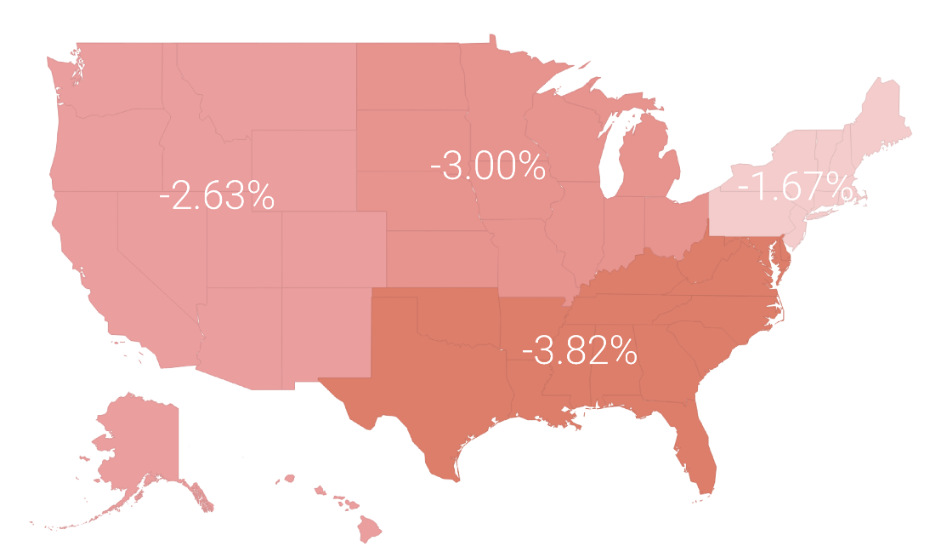
In a volatile market in 2015, the average investor lost 3.1%. In today's post, we break this performance down by region, profession, and age.
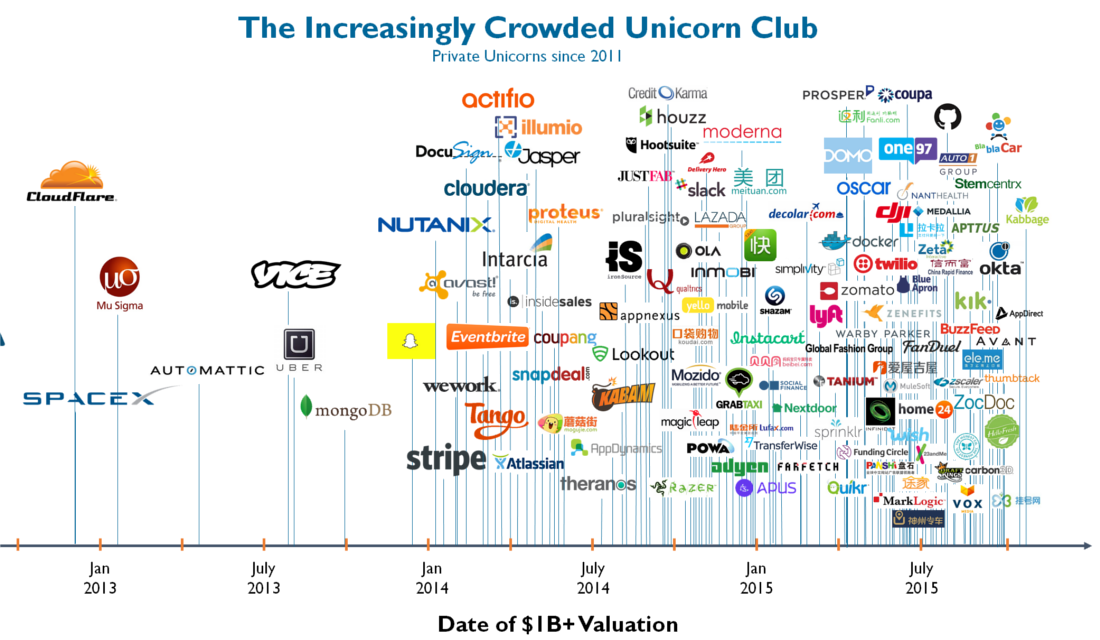
The elite group of startups worth over $1 billion - the unicorn club - is becoming increasingly crowded. Will it continue to remain frothy for investors?
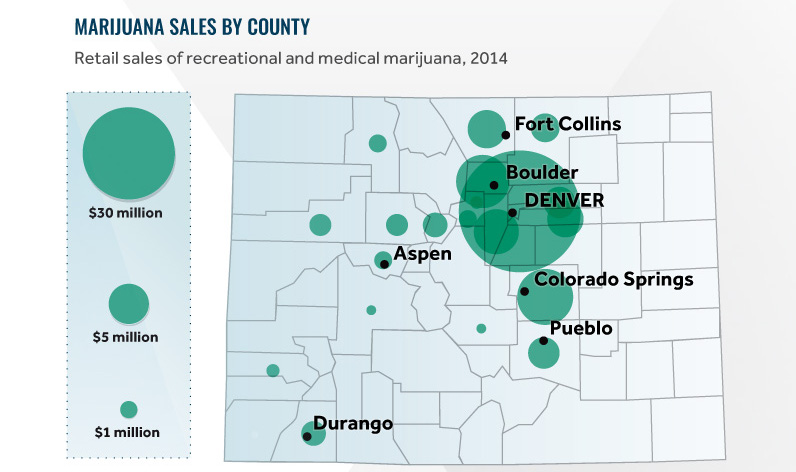
Big changes in public opinion and legalization are affecting the future of cannabis in North America. See five trends investors should know in this infographic.
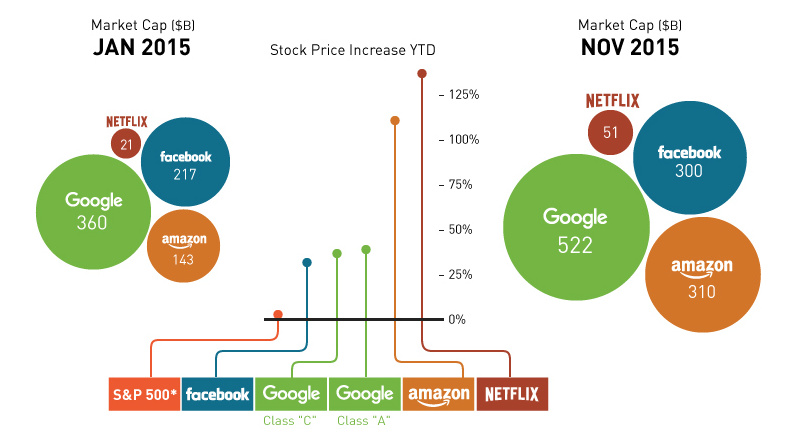
The FANG stocks (Facebook, Amazon, Netflix, and Google) are a group of tech companies that have carried the market this year, creating $440B in value YTD.
How new media has ushered in a better experience for investors. Welcome to the modern era of investor relations.
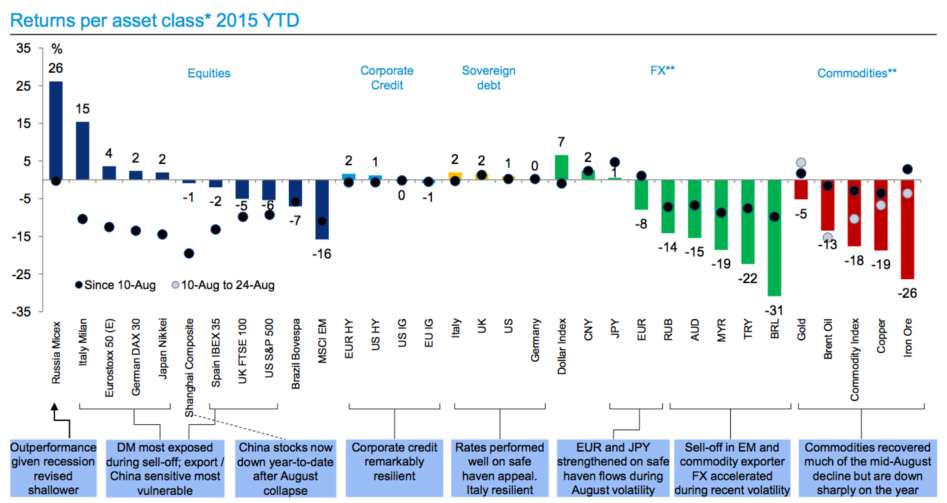
With August's meltdown, most assets have had a rough year. This snapshot from Deutsche Bank shows YTD performance, and one market that has bucked the trend.
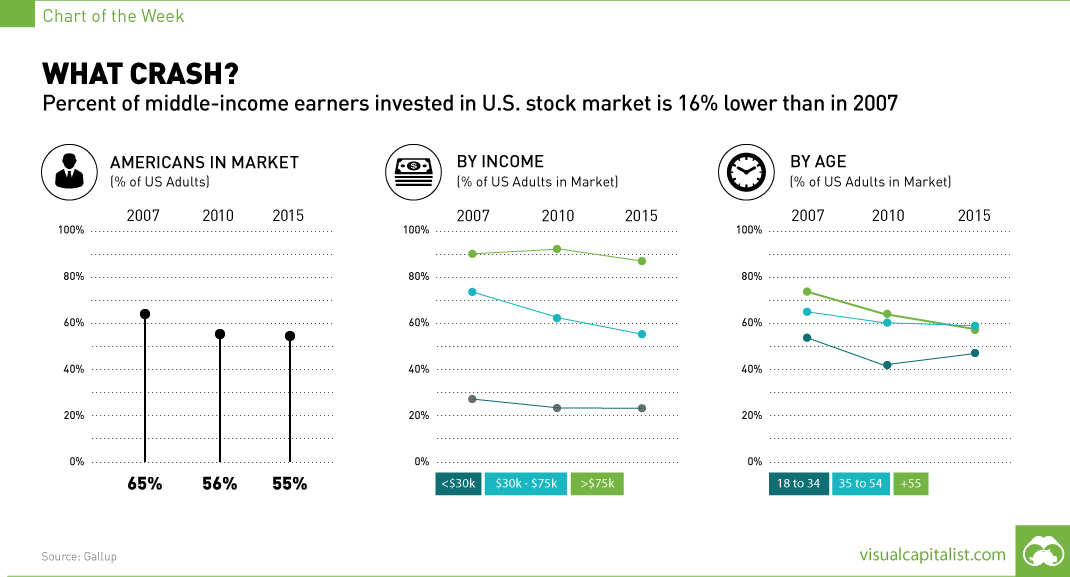
Polls show that fewer Americans are in the stock market than in the last two decades. The biggest casualties have been lower and middle income earners.
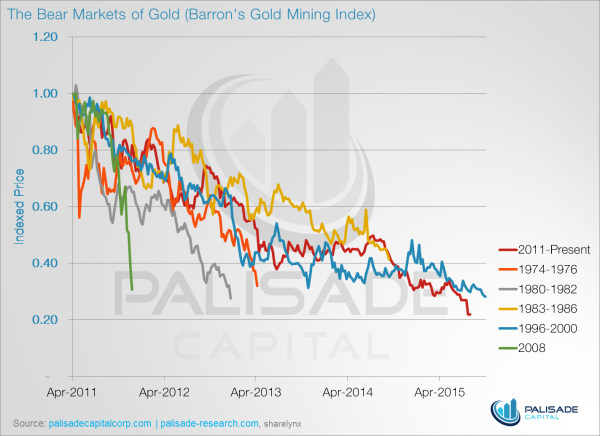
These five charts show why gold stocks have never been cheaper.
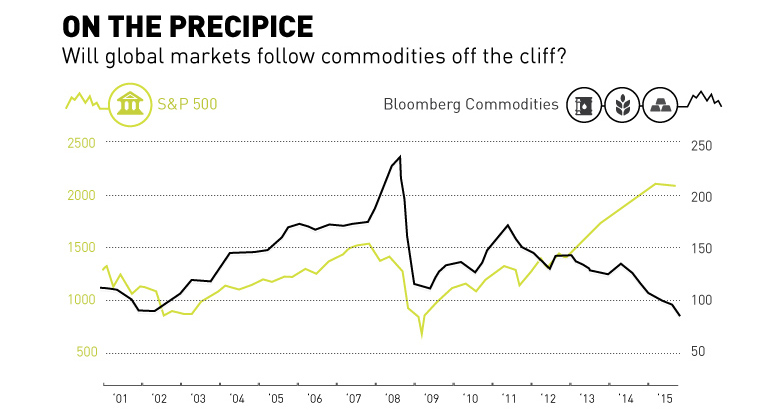
Commodities have fell off the cliff with oil and base metals getting crushed over the last year. Is the general market about to follow the same...
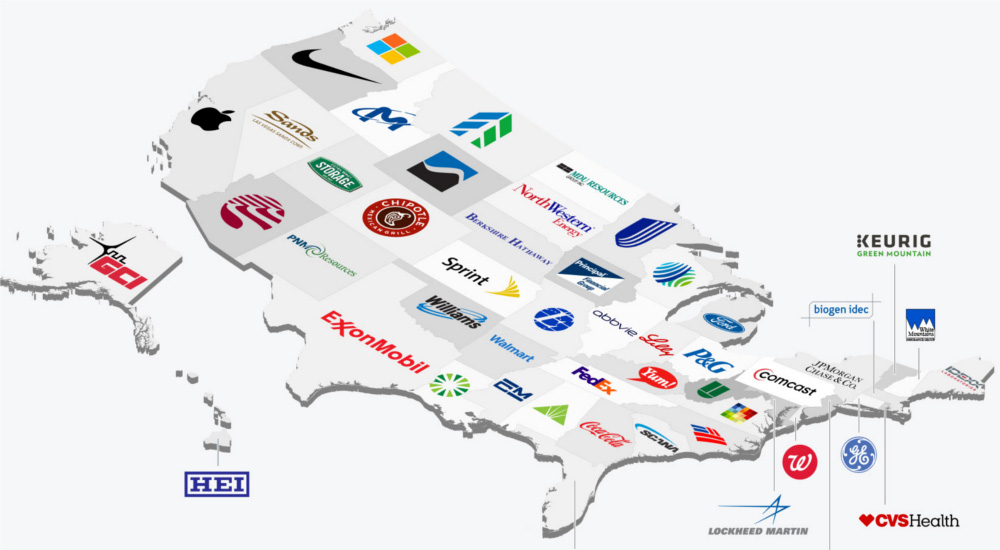
The biggest public company by market capitalization in California is Apple, and it happens to be 4000x the size of the biggest pubco in Wyoming.


