Technology
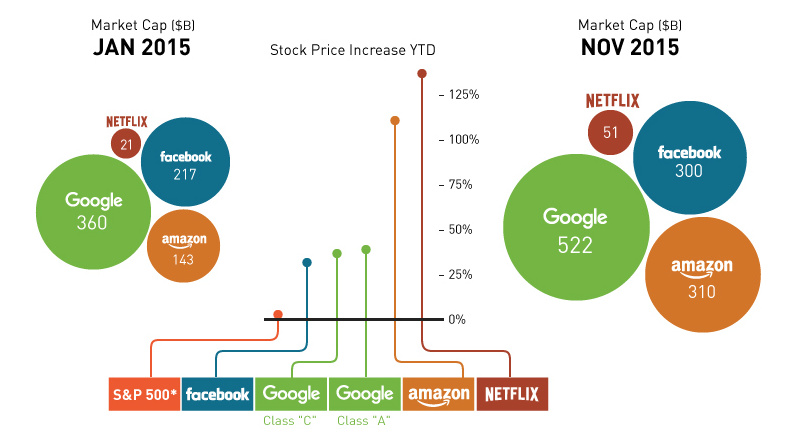
The Market Has No Bite Without the “FANG” Stocks [Chart]
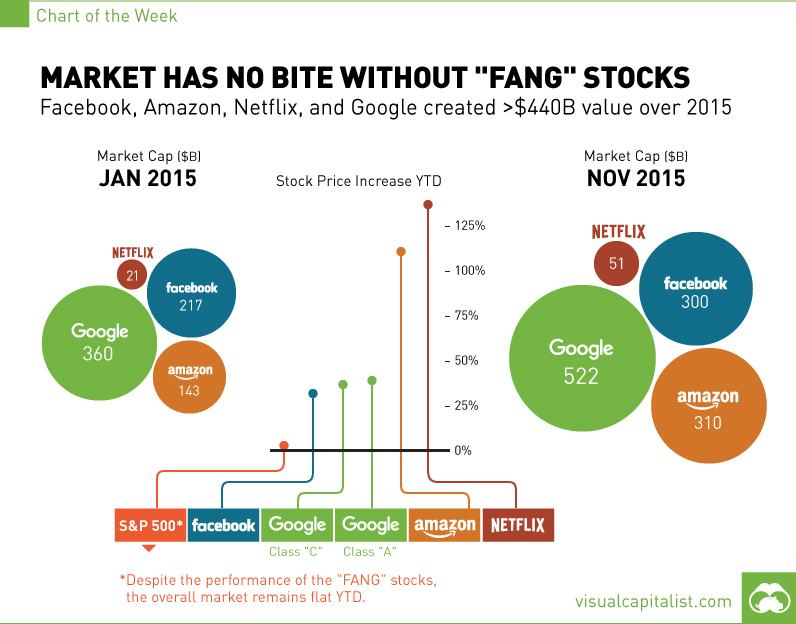
The Market Has No Bite Without the “FANG” Stocks [Chart]
Facebook, Amazon, Netflix, and Google created over $440 in value over 2015
The Chart of the Week is a weekly Visual Capitalist feature on Fridays.
In the sixth year of the bull run, the U.S. large cap market has had its ups and downs. The S&P 500 peaked at 2134.7 in the early summer months, and promptly collapsed to 1867 points during the August flash crash.
Today, it’s back in black, but only trading just over 1% higher than it started the year.
The only reason that has made this possible is the legendary performance of four tech stocks: Facebook, Amazon, Netflix, and Google (now called “Alphabet Inc.”). Together, the “FANG” stocks have created an impressive $440 billion in market capitalization since January.
For comparisons sake: that’s over 2/3 the size of Apple’s current market cap.
The FANG stocks comprised just over 3.5% of the weight of the S&P 500 index at the beginning of the year, and now they make up 5.1%. They’ve carried the market, and without them the S&P 500 would surely be in negative territory today.
Looking at these companies individually, probably Amazon (AMZN) has been the most impressive over the course of the year. While it didn’t shoot up the 143% that Netflix (NFLX) did, Amazon had a similar performance despite being over 6x the size of Netflix. Amazon is now bigger than Facebook in terms of market cap, and achieved a gain of 116% through the year.
The only problem is that it is now the most expensive stock on the index, at a seemingly ludicrous P/E ratio of 966. The other stocks are expensive as well: Netflix and Facebook are trading at 329 and 108 times earnings respectively. Google is the lone palatable company from that perspective, trading at only 35 times earnings.
This raises the question of how long the FANG stocks can carry the load, and if their work is done.
If so, who will step up to the plate?


Technology
Countries With the Highest Rates of Crypto Ownership
While the U.S. is a major market for cryptocurrencies, two countries surpass it in terms of their rates of crypto ownership.


Countries With the Highest Rates of Crypto Ownership
This was originally posted on our Voronoi app. Download the app for free on iOS or Android and discover incredible data-driven charts from a variety of trusted sources.
This graphic ranks the top 10 countries by their rate of cryptocurrency ownership, which is the percentage of the population that owns crypto. These figures come from crypto payment gateway, Triple-A, and are as of 2023.
Data and Highlights
The table below lists the rates of crypto ownership in the top 10 countries, as well as the number of people this amounts to.
| Country | % of Population Who Own Crypto | # of Crypto Owners |
|---|---|---|
| 🇦🇪 United Arab Emirates | 30.4 | 3M |
| 🇻🇳 Vietnam | 21.2 | 21M |
| 🇺🇸 U.S. | 15.6 | 53M |
| 🇮🇷 Iran | 13.5 | 12M |
| 🇵🇭 Philippines | 13.4 | 16M |
| 🇧🇷 Brazil | 12 | 26M |
| 🇸🇦 Saudi Arabia | 11.4 | 4M |
| 🇸🇬 Singapore | 11.1 | 665K |
| 🇺🇦 Ukraine | 10.6 | 4M |
| 🇻🇪 Venezuela | 10.3 | 3M |
Note that if we were to rank countries based on their actual number of crypto owners, India would rank first at 93 million people, China would rank second at 59 million people, and the U.S. would rank third at 52 million people.
The UAE Takes the Top Spot
The United Arab Emirates (UAE) boasts the highest rates of crypto ownership globally. The country’s government is considered to be very crypto friendly, as described in Henley & Partners’ Crypto Wealth Report 2023:
In the UAE, the Financial Services Regulatory Authority (FSRA-ADGM) was the first to provide rules and regulations regarding cryptocurrency purchasing and selling. The Emirates are generally very open to new technologies and have proposed zero taxes for crypto owners and businesses.
Vietnam leads Southeast Asia
According to the Crypto Council for Innovation, cryptocurrency holdings in Vietnam are also untaxed, making them an attractive asset.
Another reason for Vietnam’s high rates of ownership could be its large unbanked population (people without access to financial services). Cryptocurrencies may provide an alternative means of accessing these services without relying on traditional banks.
Learn More About Crypto From Visual Capitalist
If you enjoyed this post, be sure to check out The World’s Largest Corporate Holders of Bitcoin, which ranks the top 12 publicly traded companies by their Bitcoin holdings.

-

 Markets5 days ago
Visualizing Global Inflation Forecasts (2024-2026)
-

 Green2 weeks ago
The Carbon Footprint of Major Travel Methods
-

 United States2 weeks ago
Visualizing the Most Common Pets in the U.S.
-

 Culture2 weeks ago
The World’s Top Media Franchises by All-Time Revenue
-

 Visual Capitalist1 week ago
Best Visualizations of April on the Voronoi App
-

 Wealth1 week ago
Charted: Which Country Has the Most Billionaires in 2024?
-

 Markets1 week ago
The Top Private Equity Firms by Country
-

 Jobs1 week ago
The Best U.S. Companies to Work for According to LinkedIn