Markets
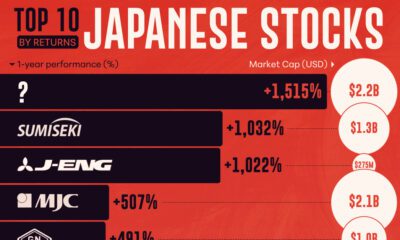
What Crash? Number of Middle-Income Earners in Stocks Drops by 16% [Chart]
![What Crash? Number of Middle-Income Earners in Stocks Drops by 16% [Chart]](https://www.visualcapitalist.com/wp-content/uploads/2015/08/what-stock-crash-chart.jpg)
What Crash? [Chart]
Number of Middle-Income Earners Invested in Stock Market Drops by 16% Since 2007
The Chart of the Week is a weekly Visual Capitalist feature on Fridays.
Over the last six years, with some help of the loosest monetary policy in history, the S&P 500 tripled in value from its lows during the Financial Crisis. Then in the last week, U.S. markets have been up and down like a roller coaster with surprising daily movements of historical proportions in both directions. Currently, at our time of publication, the DJIA is down -7% year-to-date.
While the majority of investors are familiar with the above story, this time there are millions of fewer people along for the ride. And most of those that sat this one out are middle or lower income earners.
Several polls tell the same story, which is that the number of Americans invested in the stock market has decreased significantly since 2007, the year before the Financial Crisis. In a series of Gallup polls, which are what we use for today’s chart, respondents were asked the following question: “Do you, personally, or jointly with a spouse, have any money invested in the stock market right now — either in an individual stock, a stock mutual fund, or in a self-directed 401(k) or IRA?”
The total number of adults invested in the market has decreased from 65% (2007) to 55% (today). More alarmingly, it is people in the lower and middle income classes that make up the vast majority of this drop. For people making between $30k and $75k per year, the percentage of those invested has decreased from 72% to 56%. For those making less than $30k, it decreased from 28% to 21%.
The folks that make over $75k per year? The percentage is close to the same, going from 90% to 88% – likely the result of some baby boomers retiring or focusing on fixed income securities in their later years.
Going back further in the data, it actually turns out that the total amount of people invested in the markets is lower than virtually any time in the last two decades. Part of this is because of recent stagnation in wages, and another part is related to the rising distrust in the financial system itself.
In our view, part of the problem is also that policies such as quantitative easing, zero interest-rates, and bank bailouts tend to help those out that are closer to the top of the food chain. Inflating asset bubbles help the people that own such assets, and low rates give well-off people access to even more capital to invest with. However, for the middle and lower income earners that rely on regular paychecks to accumulate capital, these same policies encourage consumption and indebtedness. Lower earners do not get to see their house or stock portfolio sail in growth because they do not own them. They also rely more on credit cards, which have only dropped from 14.5% to 13% in average rates.
So don’t be surprised this weekend when your neighbor is unaware of the stock market mayhem over the last week. The majority of people in middle and lower income classes didn’t experience it.


Markets
U.S. Debt Interest Payments Reach $1 Trillion
U.S. debt interest payments have surged past the $1 trillion dollar mark, amid high interest rates and an ever-expanding debt burden.


U.S. Debt Interest Payments Reach $1 Trillion
This was originally posted on our Voronoi app. Download the app for free on iOS or Android and discover incredible data-driven charts from a variety of trusted sources.
The cost of paying for America’s national debt crossed the $1 trillion dollar mark in 2023, driven by high interest rates and a record $34 trillion mountain of debt.
Over the last decade, U.S. debt interest payments have more than doubled amid vast government spending during the pandemic crisis. As debt payments continue to soar, the Congressional Budget Office (CBO) reported that debt servicing costs surpassed defense spending for the first time ever this year.
This graphic shows the sharp rise in U.S. debt payments, based on data from the Federal Reserve.
A $1 Trillion Interest Bill, and Growing
Below, we show how U.S. debt interest payments have risen at a faster pace than at another time in modern history:
| Date | Interest Payments | U.S. National Debt |
|---|---|---|
| 2023 | $1.0T | $34.0T |
| 2022 | $830B | $31.4T |
| 2021 | $612B | $29.6T |
| 2020 | $518B | $27.7T |
| 2019 | $564B | $23.2T |
| 2018 | $571B | $22.0T |
| 2017 | $493B | $20.5T |
| 2016 | $460B | $20.0T |
| 2015 | $435B | $18.9T |
| 2014 | $442B | $18.1T |
| 2013 | $425B | $17.2T |
| 2012 | $417B | $16.4T |
| 2011 | $433B | $15.2T |
| 2010 | $400B | $14.0T |
| 2009 | $354B | $12.3T |
| 2008 | $380B | $10.7T |
| 2007 | $414B | $9.2T |
| 2006 | $387B | $8.7T |
| 2005 | $355B | $8.2T |
| 2004 | $318B | $7.6T |
| 2003 | $294B | $7.0T |
| 2002 | $298B | $6.4T |
| 2001 | $318B | $5.9T |
| 2000 | $353B | $5.7T |
| 1999 | $353B | $5.8T |
| 1998 | $360B | $5.6T |
| 1997 | $368B | $5.5T |
| 1996 | $362B | $5.3T |
| 1995 | $357B | $5.0T |
| 1994 | $334B | $4.8T |
| 1993 | $311B | $4.5T |
| 1992 | $306B | $4.2T |
| 1991 | $308B | $3.8T |
| 1990 | $298B | $3.4T |
| 1989 | $275B | $3.0T |
| 1988 | $254B | $2.7T |
| 1987 | $240B | $2.4T |
| 1986 | $225B | $2.2T |
| 1985 | $219B | $1.9T |
| 1984 | $205B | $1.7T |
| 1983 | $176B | $1.4T |
| 1982 | $157B | $1.2T |
| 1981 | $142B | $1.0T |
| 1980 | $113B | $930.2B |
| 1979 | $96B | $845.1B |
| 1978 | $84B | $789.2B |
| 1977 | $69B | $718.9B |
| 1976 | $61B | $653.5B |
| 1975 | $55B | $576.6B |
| 1974 | $50B | $492.7B |
| 1973 | $45B | $469.1B |
| 1972 | $39B | $448.5B |
| 1971 | $36B | $424.1B |
| 1970 | $35B | $389.2B |
| 1969 | $30B | $368.2B |
| 1968 | $25B | $358.0B |
| 1967 | $23B | $344.7B |
| 1966 | $21B | $329.3B |
Interest payments represent seasonally adjusted annual rate at the end of Q4.
At current rates, the U.S. national debt is growing by a remarkable $1 trillion about every 100 days, equal to roughly $3.6 trillion per year.
As the national debt has ballooned, debt payments even exceeded Medicaid outlays in 2023—one of the government’s largest expenditures. On average, the U.S. spent more than $2 billion per day on interest costs last year. Going further, the U.S. government is projected to spend a historic $12.4 trillion on interest payments over the next decade, averaging about $37,100 per American.
Exacerbating matters is that the U.S. is running a steep deficit, which stood at $1.1 trillion for the first six months of fiscal 2024. This has accelerated due to the 43% increase in debt servicing costs along with a $31 billion dollar increase in defense spending from a year earlier. Additionally, a $30 billion increase in funding for the Federal Deposit Insurance Corporation in light of the regional banking crisis last year was a major contributor to the deficit increase.
Overall, the CBO forecasts that roughly 75% of the federal deficit’s increase will be due to interest costs by 2034.

-

 Green1 week ago
Ranked: The Countries With the Most Air Pollution in 2023
-

 Automotive2 weeks ago
Almost Every EV Stock is Down After Q1 2024
-

 AI2 weeks ago
The Stock Performance of U.S. Chipmakers So Far in 2024
-

 Markets2 weeks ago
Charted: Big Four Market Share by S&P 500 Audits
-

 Real Estate2 weeks ago
Ranked: The Most Valuable Housing Markets in America
-

 Money2 weeks ago
Which States Have the Highest Minimum Wage in America?
-

 AI2 weeks ago
Ranked: Semiconductor Companies by Industry Revenue Share
-

 Travel2 weeks ago
Ranked: The World’s Top Flight Routes, by Revenue