Misc
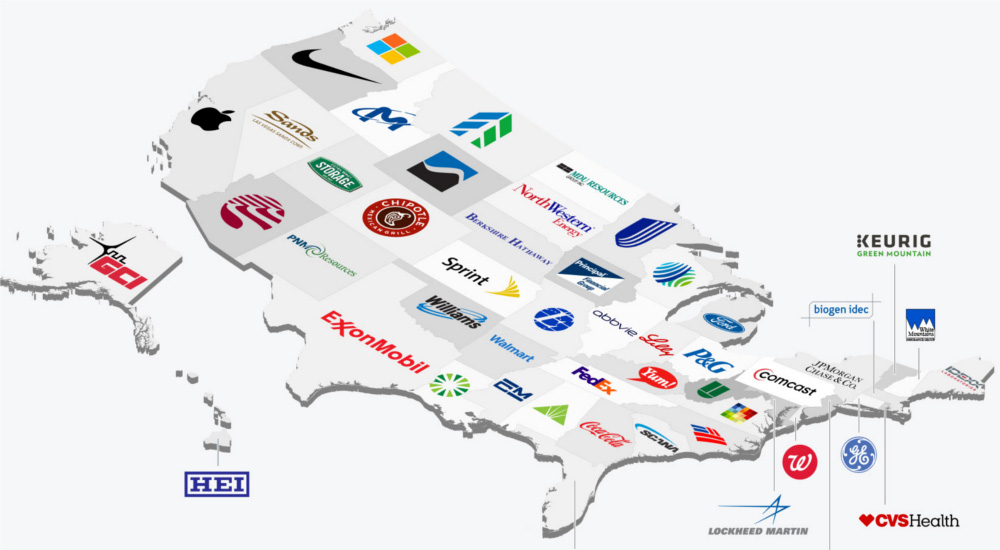
The Biggest Public Company in Every U.S. State
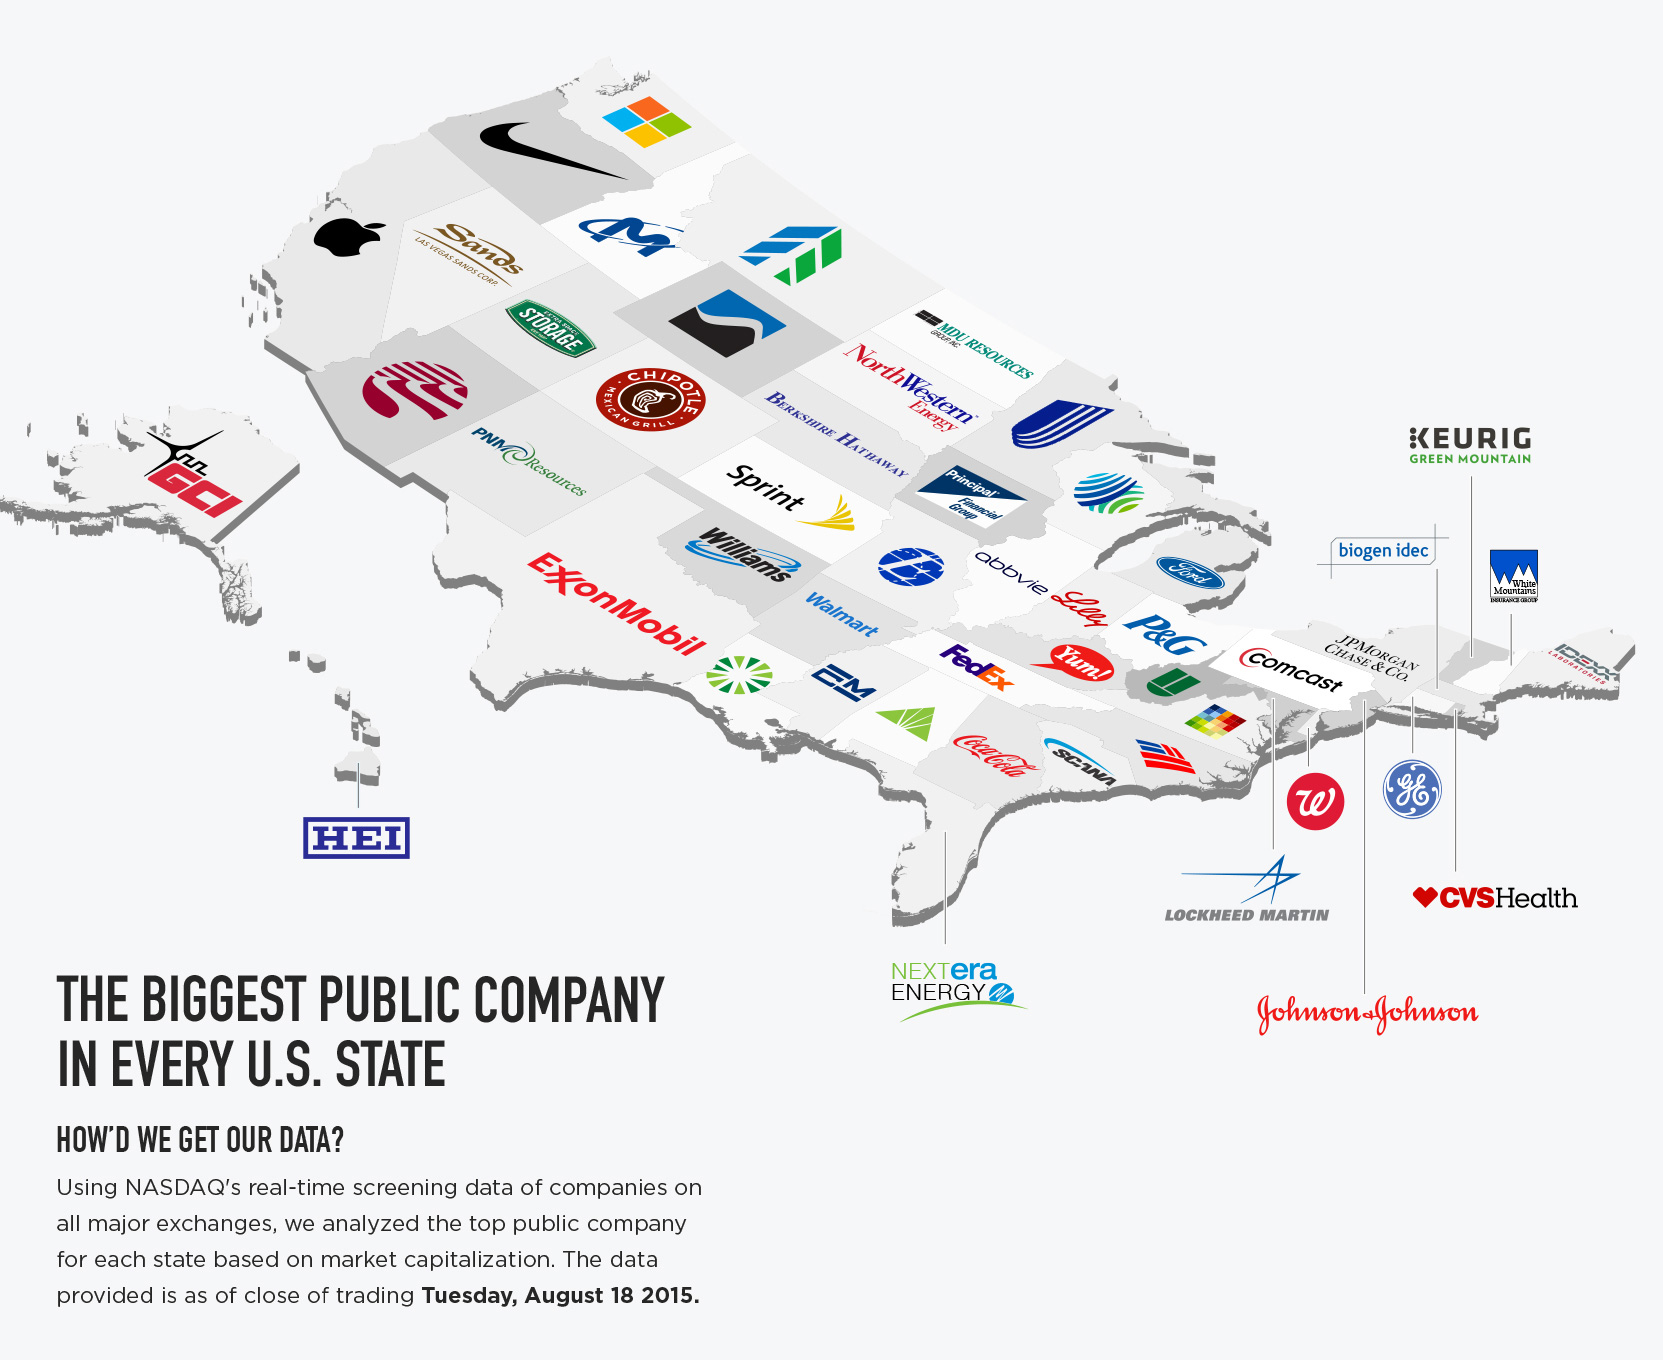
The Biggest Public Company in Every U.S. State
The range in magnitude between public companies is always humbling. Investors trade billions of dollars in the shares of behemoths like Apple and General Electric in a day. Meanwhile, the majority of companies couldn’t be valued at a billion dollars even in the wildest dreams of their management teams.
When looking at the largest public company in each state, one would think that it would be a collection of roughly 50 behemoths. Surprisingly, this is not the case at all.
Our friends at Blender Media pulled up the market capitalization of the largest pubcos in each state, and they are now beautifully arranged in today’s infographic. The data for all of the companies is below, and it is somewhat staggering.
Yes, Apple is huge as it tries to continue its journey to $1 trillion in value. There are some other big companies as well: Microsoft, Berkshire Hathaway, and ExxonMobil are all worth over $300 billion. However, the list also really starts to drop off halfway through.
Regions Financial Corp. is the biggest pubco in Alabama ($14 billion), Extra Space Storage is crushing it in Utah ($9.7 billion), IDEXX Laboratories is big in Maine ($7.4 billion), but then things get even more obscure.
Alaska’s largest public company, General Communication, trades at a market capitalization of only $700 million. Meanwhile, Wyoming’s biggest company is technically a smallcap: Cloud Peak Energy is worth only $166 million in value.
| State | Company Name | Market Cap (Billions) | Stock Symbol |
|---|---|---|---|
| California | Apple Inc. | 668.7 | AAPL |
| Washington | Microsoft Corporation | 378.62 | MSFT |
| Nebraska | Berkshire Hathaway Inc. | 349.11 | BRK-A |
| Texas | Exxon Mobil Corporation | 323.84 | XOM |
| New Jersey | Johnson & Johnson | 275.08 | JNJ |
| Connecticut | General Electric | 263.1 | GE |
| New York | JPMorgan Chase & Co. | 251.77 | JPM |
| Arkansas | Walmart | 224.28 | WMT |
| Ohio | Procter & Gamble Company | 203.74 | PG |
| North Carolina | Bank of America Corporation | 184.76 | BAC |
| Georgia | Coca-Cola Company | 180.02 | KO |
| Pennsylvania | Comcast Corporation | 150.02 | CMCSK |
| Rhode Island | CVS Health Corporation | 121.12 | CVS |
| Minnesota | UnitedHealth Group Inc. | 119.77 | UNH |
| Illinois | AbbVie Inc. | 113.97 | ABBV |
| Virginia | Altria Group | 108.54 | MO |
| Delaware | Walgreens Boots Alliance, Inc. | 100.45 | WBA |
| Oregon | Nike, Inc. | 98.04 | NIKE |
| Indiana | Eli Lilly and Company | 88.28 | LLY |
| Massachusetts | Biogen Inc. | 73.29 | BIIB |
| Maryland | Lockheed Martin Corporation | 66.13 | LMT |
| District of Columbia | Danaher Corporation | 62.65 | DHR |
| Missouri | Express Scripts Holding Company | 61.13 | ESRX |
| Michigan | Ford Motor Company | 59.69 | F |
| Florida | NextEra Energy, Inc. | 49.41 | NEE |
| Tennessee | FedEx Corporation | 46.96 | FDX |
| Nevada | Las Vegas Sands Corp. | 41.31 | LVS |
| Oklahoma | Williams Companies, Inc. | 40.34 | WMB |
| Kentucky | Yum! Brands, Inc. | 36.24 | YUM |
| Wisconsin | Johnson Controls, Inc. | 29.68 | JCI |
| Colorado | Chipotle Mexican Grill Inc. | 23.28 | CMG |
| Arizona | Southern Copper Corporation | 21.5 | SCCO |
| Kansas | Sprint Corporation | 18.61 | S |
| Idaho | Micron Technology, Inc. | 17.68 | MU |
| Iowa | Principal Financial Group Inc. | 16.97 | PFG |
| Louisiana | CenturyLink, Inc. | 15.88 | CTL |
| Alabama | Regions Financial Corporation | 13.95 | RF |
| Utah | Extra Space Storage Inc. | 9.65 | EXR |
| South Carolina | Scana Corporation | 8.14 | SCG |
| Vermont | Keurig Green Mountain, Inc. | 7.79 | GMCR |
| Maine | IDEXX Laboratories, Inc. | 7.35 | IDXX |
| New Hampshire | White Mountains Insurance Group, Ltd. | 4.35 | WTM |
| North Dakota | MDU Resources Group, Inc. | 3.63 | MDU |
| Hawaii | Hawaiian Electric Industries Inc. | 3.29 | HE |
| West Virginia | United Bankshares, Inc. | 2.76 | USBI |
| South Dakota | NorthWestern Corporation | 2.62 | NW E |
| Mississippi | Cal-Maine Foods, Inc. | 2.52 | CALM |
| New Mexico | PNM Resources, Inc. | 2.2 | PNM |
| Montana | Glacier Bancorp, Inc. | 2.12 | CBCI |
| Alaska | General Communication, Inc. | 0.697 | GNCMA |
| Wyoming | Cloud Peak Energy Inc. | 0.166 | CLD |
Original graphic by: Blender Media


VC+
VC+: Get Our Key Takeaways From the IMF’s World Economic Outlook
A sneak preview of the exclusive VC+ Special Dispatch—your shortcut to understanding IMF’s World Economic Outlook report.

Have you read IMF’s latest World Economic Outlook yet? At a daunting 202 pages, we don’t blame you if it’s still on your to-do list.
But don’t worry, you don’t need to read the whole April release, because we’ve already done the hard work for you.
To save you time and effort, the Visual Capitalist team has compiled a visual analysis of everything you need to know from the report—and our VC+ Special Dispatch is available exclusively to VC+ members. All you need to do is log into the VC+ Archive.
If you’re not already subscribed to VC+, make sure you sign up now to access the full analysis of the IMF report, and more (we release similar deep dives every week).
For now, here’s what VC+ members get to see.
Your Shortcut to Understanding IMF’s World Economic Outlook
With long and short-term growth prospects declining for many countries around the world, this Special Dispatch offers a visual analysis of the key figures and takeaways from the IMF’s report including:
- The global decline in economic growth forecasts
- Real GDP growth and inflation forecasts for major nations in 2024
- When interest rate cuts will happen and interest rate forecasts
- How debt-to-GDP ratios have changed since 2000
- And much more!

Get the Full Breakdown in the Next VC+ Special Dispatch
VC+ members can access the full Special Dispatch by logging into the VC+ Archive, where you can also check out previous releases.
Make sure you join VC+ now to see exclusive charts and the full analysis of key takeaways from IMF’s World Economic Outlook.
Don’t miss out. Become a VC+ member today.
What You Get When You Become a VC+ Member
VC+ is Visual Capitalist’s premium subscription. As a member, you’ll get the following:
- Special Dispatches: Deep dive visual briefings on crucial reports and global trends
- Markets This Month: A snappy summary of the state of the markets and what to look out for
- The Trendline: Weekly curation of the best visualizations from across the globe
- Global Forecast Series: Our flagship annual report that covers everything you need to know related to the economy, markets, geopolitics, and the latest tech trends
- VC+ Archive: Hundreds of previously released VC+ briefings and reports that you’ve been missing out on, all in one dedicated hub
You can get all of the above, and more, by joining VC+ today.

-

 Energy1 week ago
The World’s Biggest Nuclear Energy Producers
-

 Money2 weeks ago
Which States Have the Highest Minimum Wage in America?
-

 Technology2 weeks ago
Ranked: Semiconductor Companies by Industry Revenue Share
-

 Markets2 weeks ago
Ranked: The World’s Top Flight Routes, by Revenue
-

 Countries2 weeks ago
Population Projections: The World’s 6 Largest Countries in 2075
-

 Markets2 weeks ago
The Top 10 States by Real GDP Growth in 2023
-

 Demographics2 weeks ago
The Smallest Gender Wage Gaps in OECD Countries
-

 Economy2 weeks ago
Where U.S. Inflation Hit the Hardest in March 2024