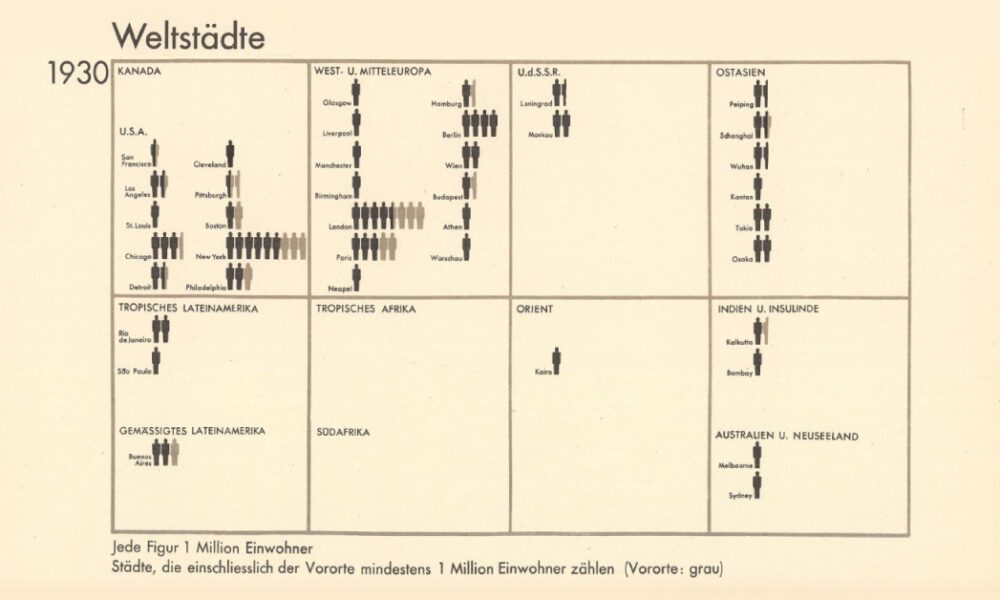
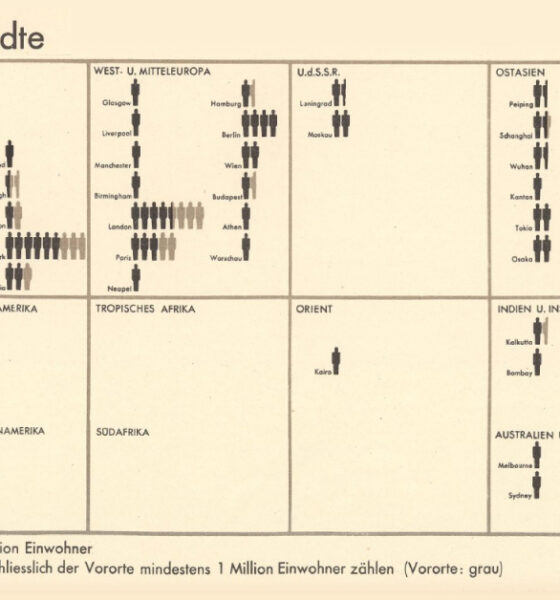
From someone born in the 19th century, in the midst of historic population growth, comes this vintage visualization showing world...
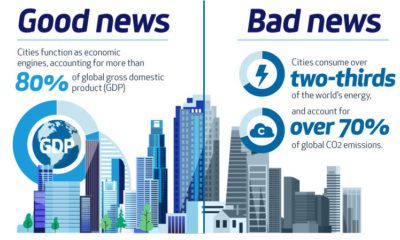

Cities are drivers of growth and prosperity, but also the main contributors of pollution. Can hydrogen fuel the growth of cities with clean power?
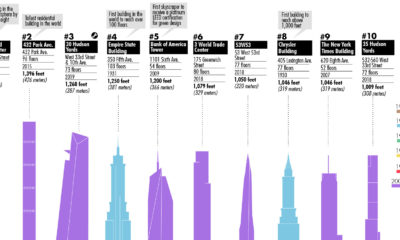

This visualization plots out the tallest buildings in New York City, as well as a few in the pipeline that will change the Big Apple's skyline...
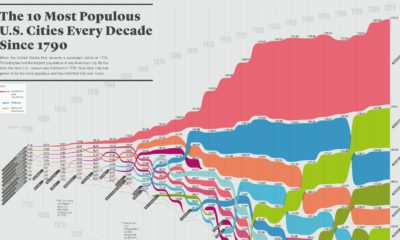

How has the list of the most populous U.S. cities changed over time? This infographic shows the top 10 cities of every decade since the year...

By 2050, there will be 2.5 billion more people living in cities than today. How is rapid urbanization set to impact investors and the global economy?v
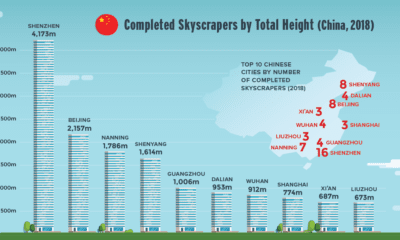

Nearly 150 skyscrapers were completed around the world last year. Find out which cities and regions are growing skyward the fastest.
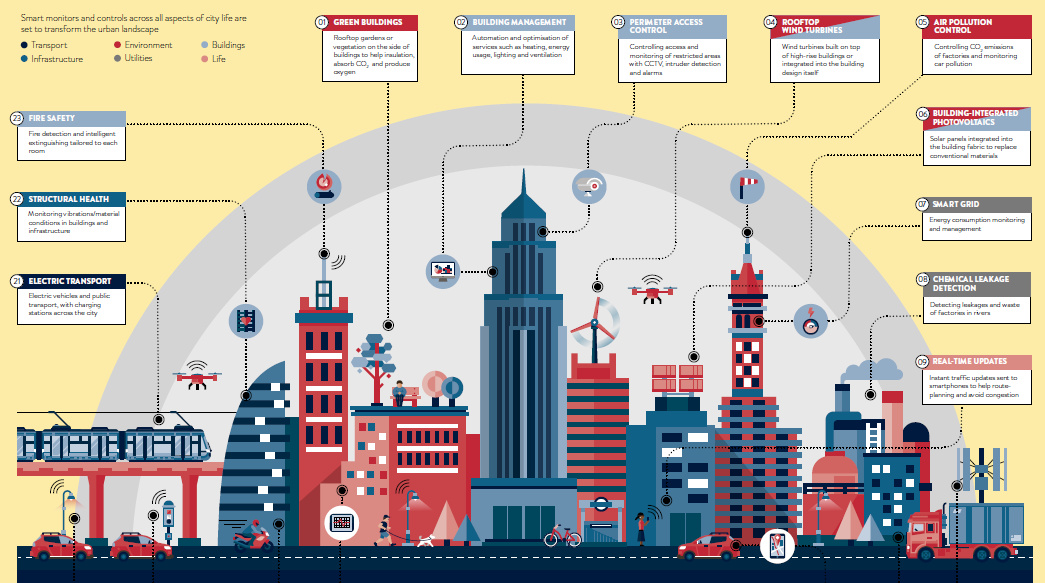
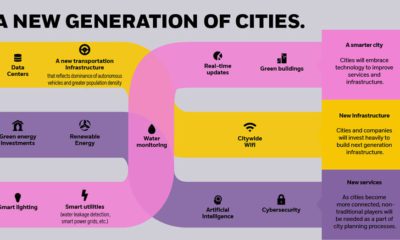
The city will remain the centerpiece of economic growth in the 21st century. Here's how we're using smart city technology to optimize them even further.
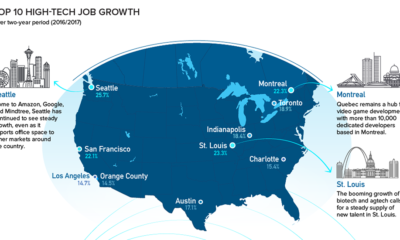

Silicon Valley is no longer the only place to be for a career in tech. Here are the fastest growing tech markets across North America, and...
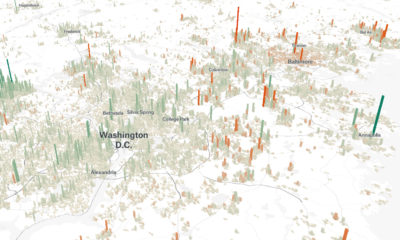

Cities are constantly evolving over time. These 3d graphics visualize both growth and decline with a focus on North American cities from 1990-2015.
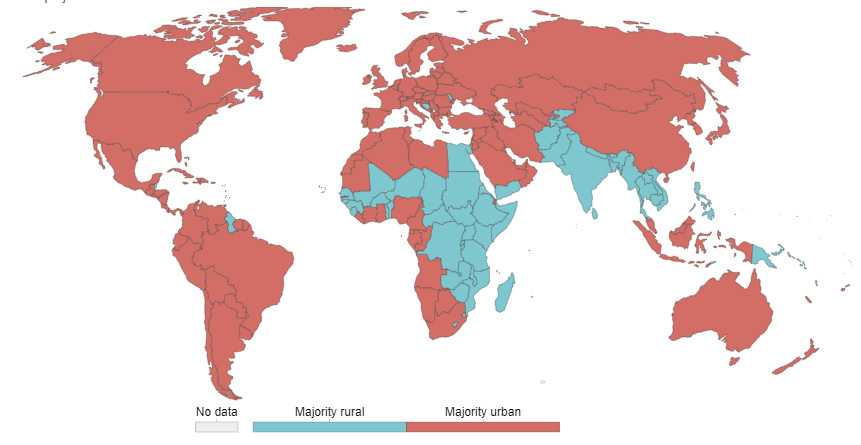
55% of the world lives in urban areas today. But what defines an urban population, and how will this big picture change by 2050?
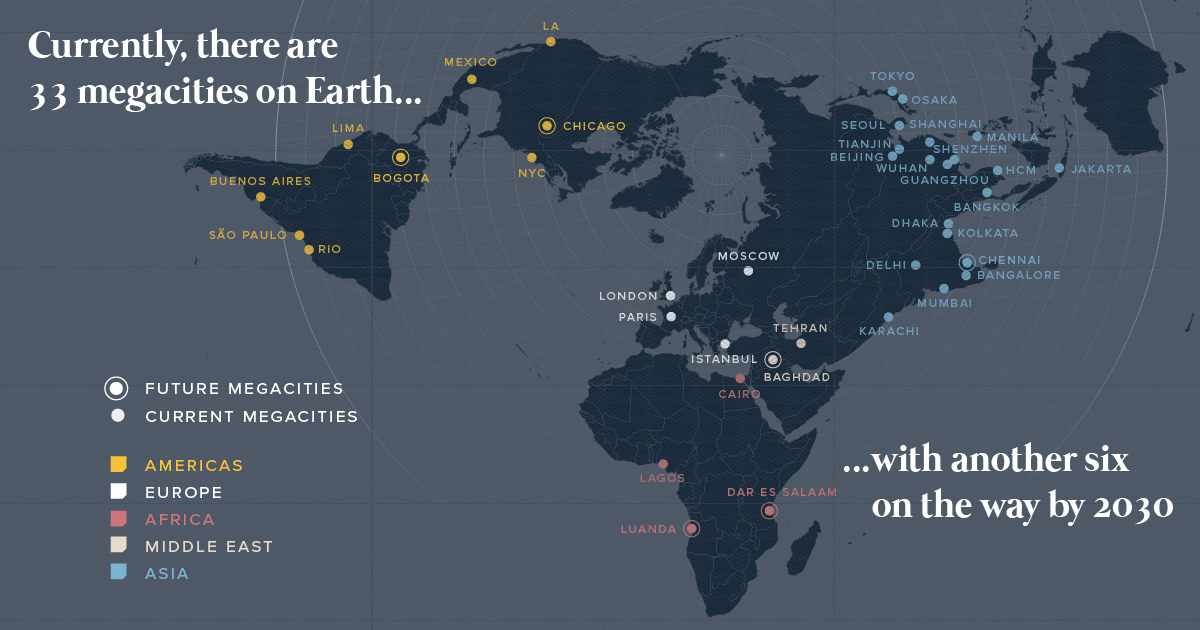
There are currently 33 megacities in the world with over 10 million inhabitants - but by 2030, there will be six new megacities, including one in...


