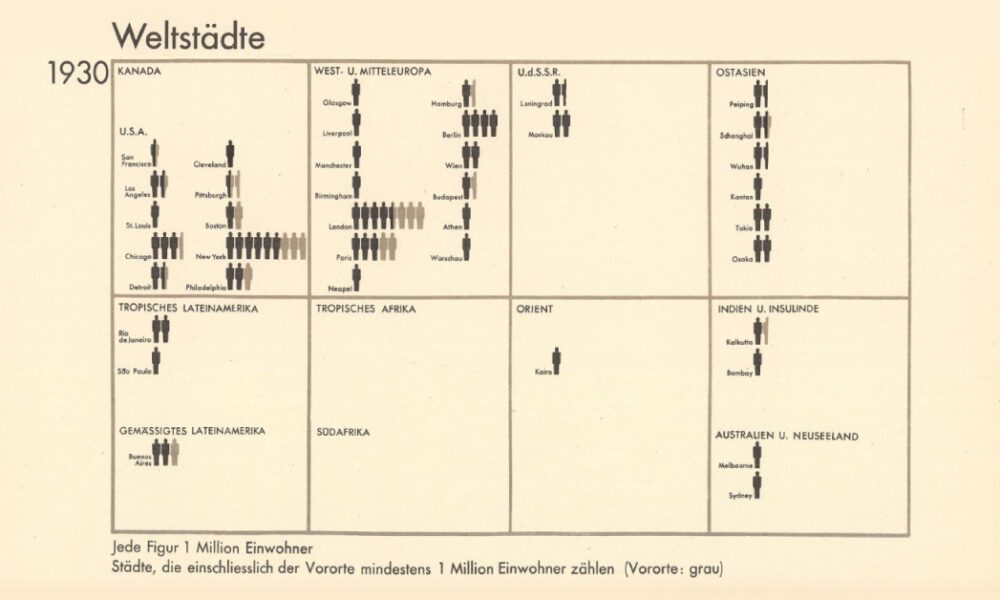
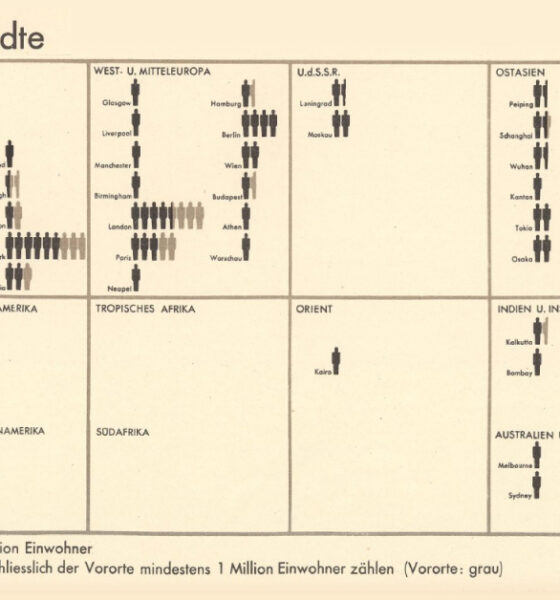
From someone born in the 19th century, in the midst of historic population growth, comes this vintage visualization showing world...

Visualizing the most affordable U.S. cities for renters by the percentage of affordable rentals available on an average salary.

Visualizing the least affordable U.S. cities for renters by the percentage of affordable rentals available on an average salary.
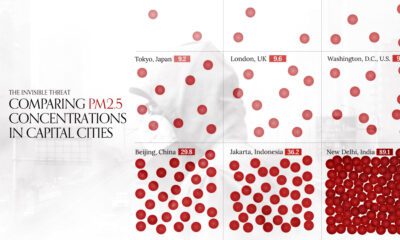

This visual compares air quality in 50 capital cities around the world by average PM2.5 concentrations in 2022.


How safe is small town America? This map reveals the safest cities in the U.S. in terms of the total crime rate per every 1,000 residents.
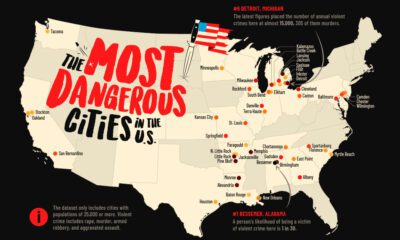

This map shows the most dangerous cities in the U.S. in terms of the violent crime rate per 1,000 residents.


There's more to consider than the price tag when purchasing a house. This ranking reveals the most affordable U.S. cities for home buyers.
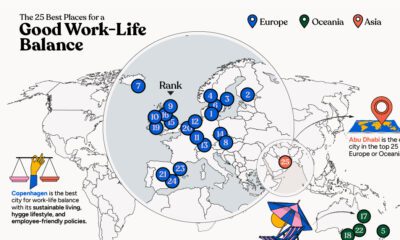

In this infographic, we explore which cities around the world excel in prioritizing work–life balance.
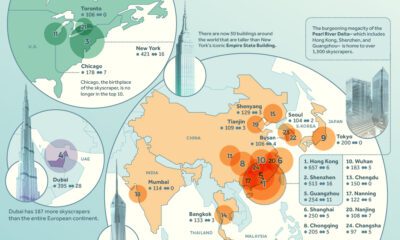

We rank the world's leading cities with the most skyscrapers, highlighting China's remarkable dominance in building vertically.


This infographic highlights the 10 cities where international travelers spend the most. In 2022, Dubai took top spot.


 Creator Program