
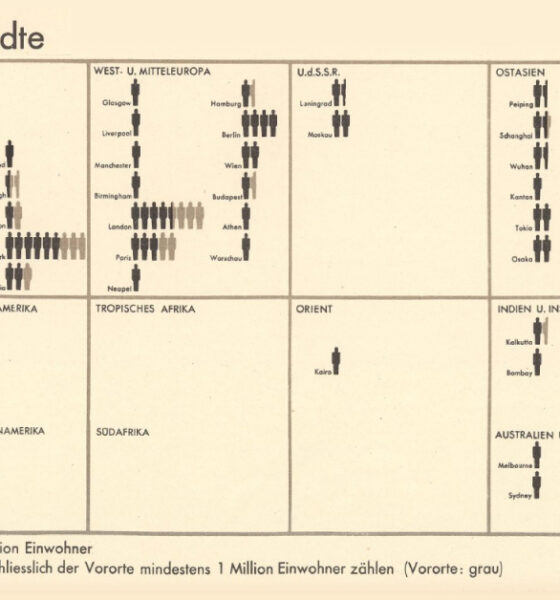
From someone born in the 19th century, in the midst of historic population growth, comes this vintage visualization showing world...
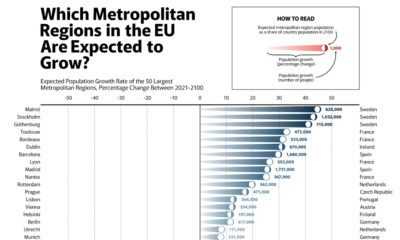

How will Europe's population grow by 2100? Most cities in the EU are expected to see surges in population growth, while a few might shrink.


From New York to Damascus, this infographic uses EIU cost of living data to rank the world's most and least expensive cities to live in


This map juxtaposes nations and Indian states to provide a new perspective on the world's soon-to-be most populous country
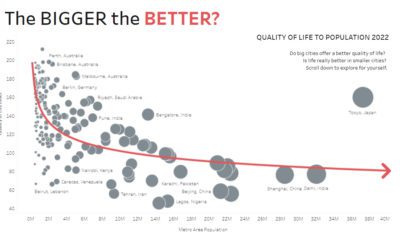

Are big cities all they’re cracked up to be? These interactive charts about population size question whether bigger always equals better.


The world's most surveilled cities contain hundreds of thousands of cameras. View this infographic to see the data in perspective.


Which cities rank as the best places to live worldwide? This map reveals the world's most and least livable cities.
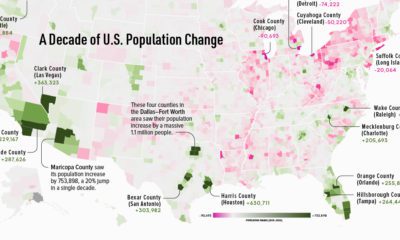

This map shows which counties in the U.S. have seen the most growth, and which places have seen their populations dwindle in the last 10 years.
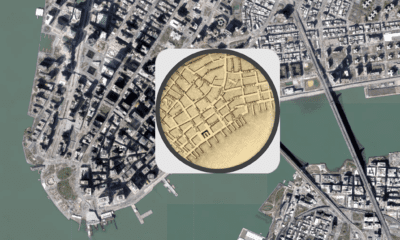

The early 1800s were a time of rapid change in New York City. This map shows the city in 1836, alongside the modern day metropolis.
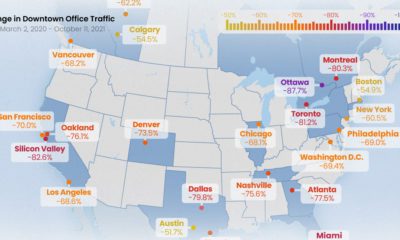

All North American downtowns are facing a sluggish recovery, but some are still seeing more than 80% less foot traffic than pre-pandemic times
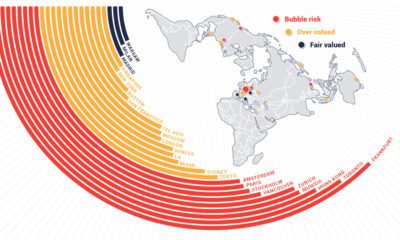

According to UBS, there are nine real estate markets that are in bubble territory with prices rising to unsustainable levels.


 Creator Program