Markets
The Least Affordable U.S. Cities for Rent on an Average Salary
Article/Editing:
The Least Affordable U.S. Cities for Rent on an Average Salary
In 2023, 34% of the 131 million households in the U.S. lived in rented homes.
But which U.S. cities are the least affordable to rent in? With runaway housing prices and local salaries struggling to keep up, some of America’s largest metros feel quite unaffordable.
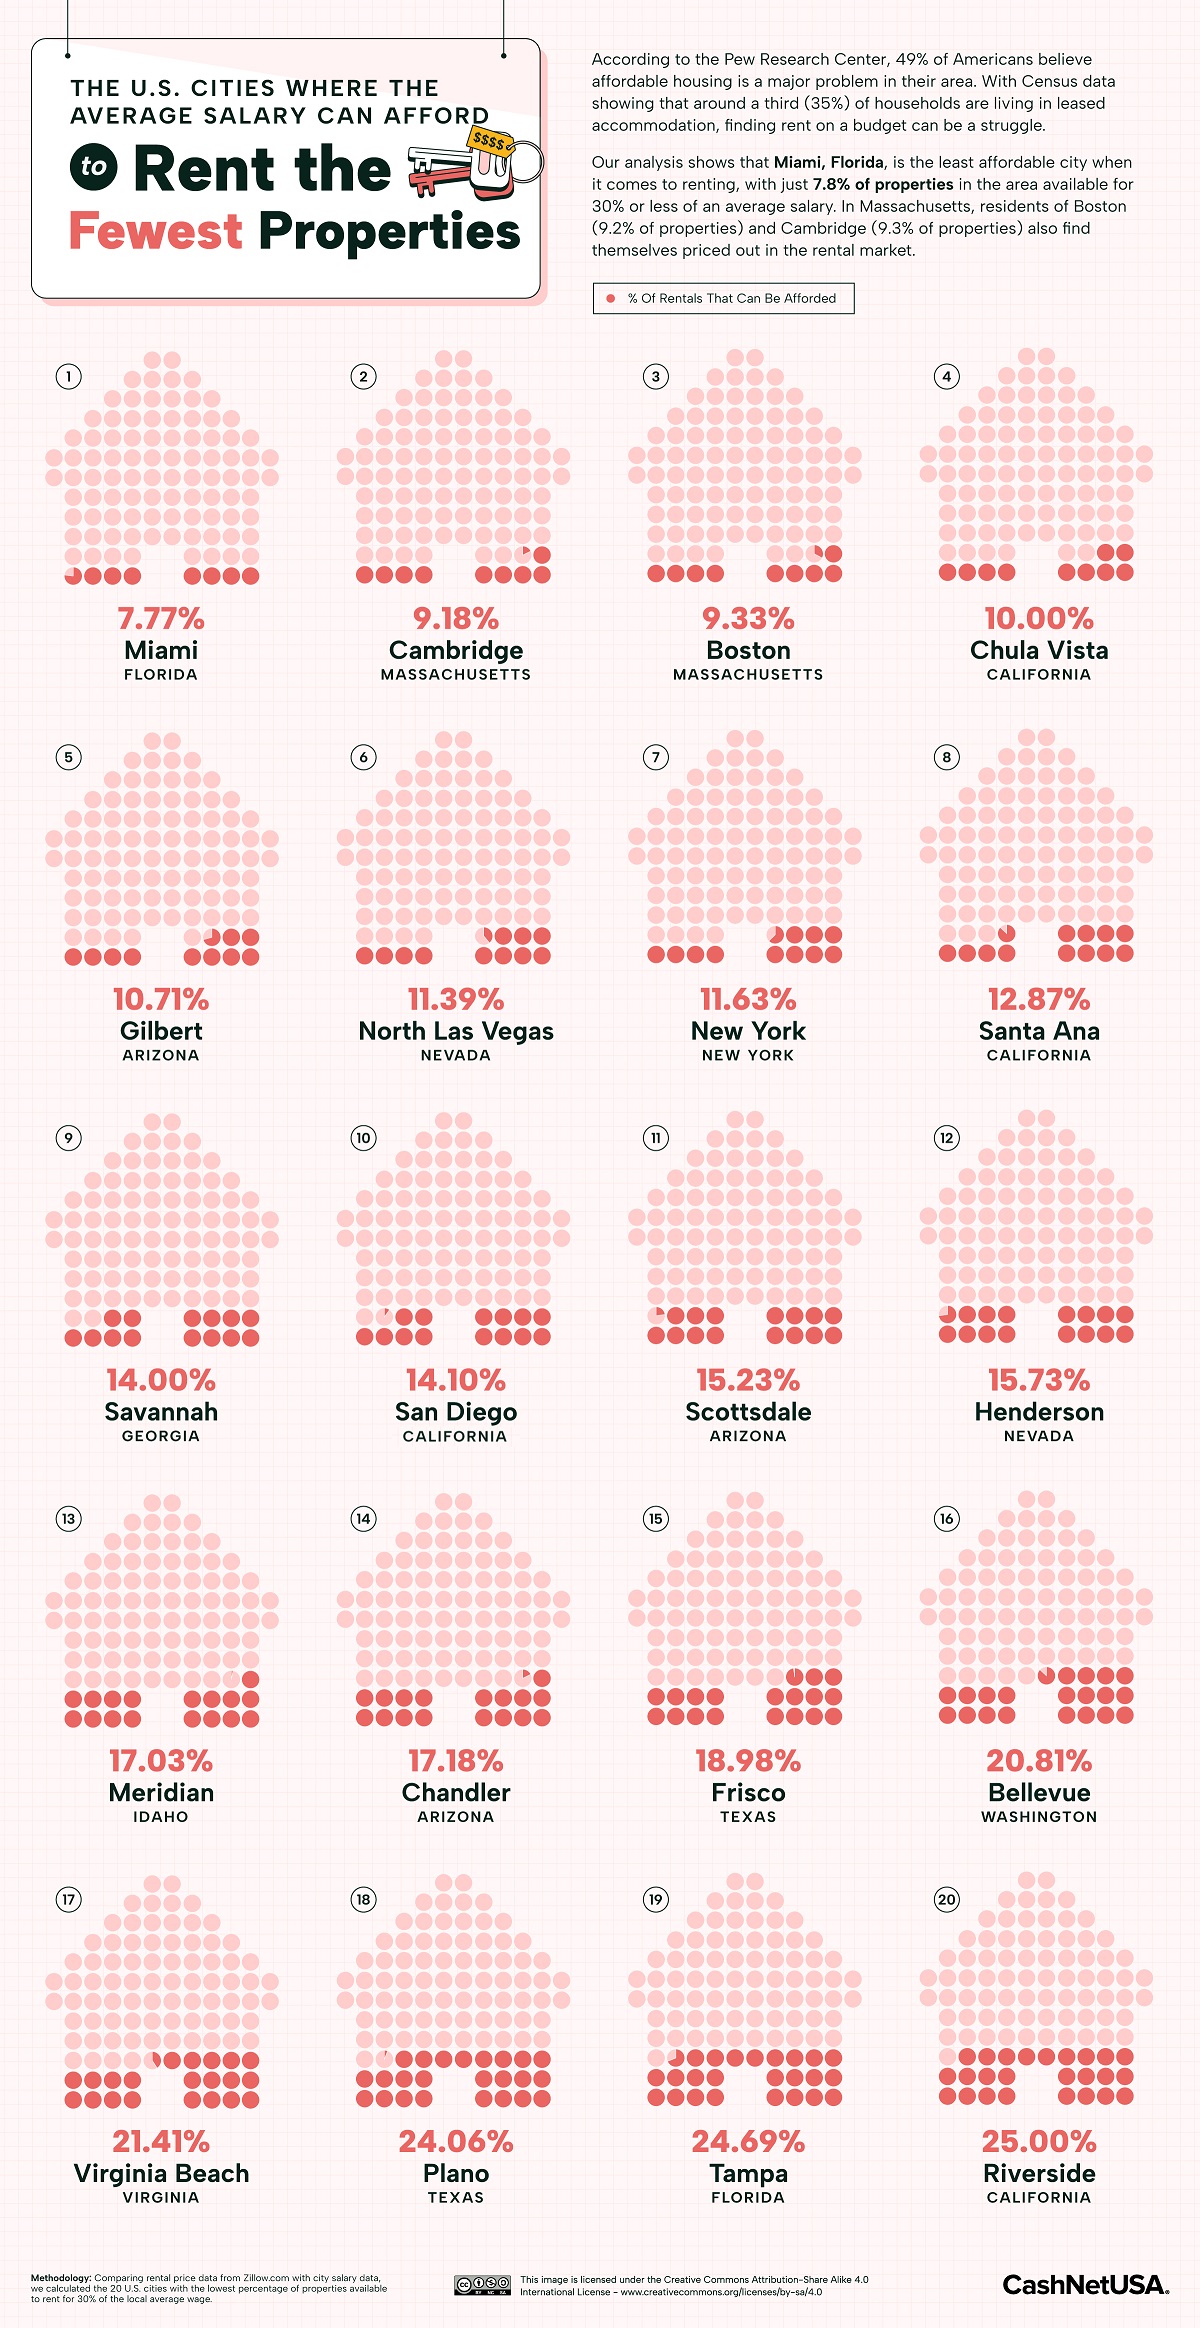
To answer the question more concretely, CashNetUSA found rental price data (as of August 2023) from Zillow.com and compared it to city salary data to calculate the percentage of properties available to rent for 30% or less of the local average income.
Which Cities are the Least Affordable?
It turns out that plenty of places are shockingly unaffordable for renters. In Miami, Cambridge, and Boston, fewer than 10% of the rental listings are affordable on a the average salary.
For context, Miami’s annual mean salary is close to $59,000, and the Boston-Cambridge area comes in at $80,000 a year. These places are also expensive for homeowners, with both Boston and Miami being in the 10 most expensive cities in the U.S. to buy a home in.
Here are the results for all cities in CashNetUSA’s study, sorted from most to least affordable:
Note: Data current as of August, 2023.
Joining Boston and Miami in the most unaffordable cities is Chula Vista in California, where exactly one in 10 the rental listings could be classified as affordable. That’s fewer than New York’s results (11.63%).
California has four of the top 20 most unaffordable cities for renters, and ranks fifth in the list of states by income inequality.
Where Does This Data Come From?
Source: CashNetUSA
Methodology: CashNetUSA sourced the average base salary of U.S. cities focusing on the 100 most populated cities in the country, plus the five most populated cities from each state. Using Zillow.com, they then counted how many rental properties per city were listed at a monthly price equivalent to 30% or less of a city’s monthly gross salary. The number of rental properties available per city was converted into a percentage score per city. Data for this research is accurate as of August 2023.

This article was published as a part of Visual Capitalist's Creator Program, which features data-driven visuals from some of our favorite Creators around the world.


Economy
Economic Growth Forecasts for G7 and BRICS Countries in 2024
The IMF has released its economic growth forecasts for 2024. How do the G7 and BRICS countries compare?


G7 & BRICS Real GDP Growth Forecasts for 2024
The International Monetary Fund’s (IMF) has released its real gross domestic product (GDP) growth forecasts for 2024, and while global growth is projected to stay steady at 3.2%, various major nations are seeing declining forecasts.
This chart visualizes the 2024 real GDP growth forecasts using data from the IMF’s 2024 World Economic Outlook for G7 and BRICS member nations along with Saudi Arabia, which is still considering an invitation to join the bloc.
Get the Key Insights of the IMF’s World Economic Outlook
Want a visual breakdown of the insights from the IMF’s 2024 World Economic Outlook report?
This visual is part of a special dispatch of the key takeaways exclusively for VC+ members.
Get the full dispatch of charts by signing up to VC+.
Mixed Economic Growth Prospects for Major Nations in 2024
Economic growth projections by the IMF for major nations are mixed, with the majority of G7 and BRICS countries forecasted to have slower growth in 2024 compared to 2023.
Only three BRICS-invited or member countries, Saudi Arabia, the UAE, and South Africa, have higher projected real GDP growth rates in 2024 than last year.
| Group | Country | Real GDP Growth (2023) | Real GDP Growth (2024P) |
|---|---|---|---|
| G7 | 🇺🇸 U.S. | 2.5% | 2.7% |
| G7 | 🇨🇦 Canada | 1.1% | 1.2% |
| G7 | 🇯🇵 Japan | 1.9% | 0.9% |
| G7 | 🇫🇷 France | 0.9% | 0.7% |
| G7 | 🇮🇹 Italy | 0.9% | 0.7% |
| G7 | 🇬🇧 UK | 0.1% | 0.5% |
| G7 | 🇩🇪 Germany | -0.3% | 0.2% |
| BRICS | 🇮🇳 India | 7.8% | 6.8% |
| BRICS | 🇨🇳 China | 5.2% | 4.6% |
| BRICS | 🇦🇪 UAE | 3.4% | 3.5% |
| BRICS | 🇮🇷 Iran | 4.7% | 3.3% |
| BRICS | 🇷🇺 Russia | 3.6% | 3.2% |
| BRICS | 🇪🇬 Egypt | 3.8% | 3.0% |
| BRICS-invited | 🇸🇦 Saudi Arabia | -0.8% | 2.6% |
| BRICS | 🇧🇷 Brazil | 2.9% | 2.2% |
| BRICS | 🇿🇦 South Africa | 0.6% | 0.9% |
| BRICS | 🇪🇹 Ethiopia | 7.2% | 6.2% |
| 🌍 World | 3.2% | 3.2% |
China and India are forecasted to maintain relatively high growth rates in 2024 at 4.6% and 6.8% respectively, but compared to the previous year, China is growing 0.6 percentage points slower while India is an entire percentage point slower.
On the other hand, four G7 nations are set to grow faster than last year, which includes Germany making its comeback from its negative real GDP growth of -0.3% in 2023.
Faster Growth for BRICS than G7 Nations
Despite mostly lower growth forecasts in 2024 compared to 2023, BRICS nations still have a significantly higher average growth forecast at 3.6% compared to the G7 average of 1%.
While the G7 countries’ combined GDP is around $15 trillion greater than the BRICS nations, with continued higher growth rates and the potential to add more members, BRICS looks likely to overtake the G7 in economic size within two decades.
BRICS Expansion Stutters Before October 2024 Summit
BRICS’ recent expansion has stuttered slightly, as Argentina’s newly-elected president Javier Milei declined its invitation and Saudi Arabia clarified that the country is still considering its invitation and has not joined BRICS yet.
Even with these initial growing pains, South Africa’s Foreign Minister Naledi Pandor told reporters in February that 34 different countries have submitted applications to join the growing BRICS bloc.
Any changes to the group are likely to be announced leading up to or at the 2024 BRICS summit which takes place October 22-24 in Kazan, Russia.
Get the Full Analysis of the IMF’s Outlook on VC+
This visual is part of an exclusive special dispatch for VC+ members which breaks down the key takeaways from the IMF’s 2024 World Economic Outlook.
For the full set of charts and analysis, sign up for VC+.

-

 Education1 week ago
How Hard Is It to Get Into an Ivy League School?
-

 Technology2 weeks ago
Ranked: Semiconductor Companies by Industry Revenue Share
-

 Markets2 weeks ago
Ranked: The World’s Top Flight Routes, by Revenue
-

 Demographics2 weeks ago
Population Projections: The World’s 6 Largest Countries in 2075
-

 Markets2 weeks ago
The Top 10 States by Real GDP Growth in 2023
-

 Demographics2 weeks ago
The Smallest Gender Wage Gaps in OECD Countries
-

 Economy2 weeks ago
Where U.S. Inflation Hit the Hardest in March 2024
-

 Green2 weeks ago
Top Countries By Forest Growth Since 2001