Mining
Boron: Making Modern Life Possible

Boron: Making Modern Life Possible
When it comes to modern living, there are so many things we take for granted.
We sleep in warm and comfortable houses, while keeping our food fresh and refrigerated. We have screens in our pockets and throughout our homes that help us to connect with our friends and family – and we can drive across town in minutes to see them, if need be.
Oddly enough, many of these subtle aspects of modern living would not be possible without the existence of very specific minerals and the developments in technology that allow them to be used to their full potential.
Enter Boron
Boron is an unlikely hero in this regard.
Today’s infographic comes from 20 Mule Team Borax, and it covers the properties, applications, market, and future trends surrounding boron. And even though you probably didn’t know much about this metalloid element before today, you’ll soon see that boron’s versatile applications make it an integral part of modern life in many ways:
In fact, boron has an incredible range of properties and uses that make it interesting to us humans:
- It’s an essential micronutrient for plants
- It improves the performance of cleaning products
- It captures neutrons, making nuclear reactors safer
- It absorbs infrared light, useful for energy efficiency
- Boron limits growth of bacteria and fungi on wood products
- It helps to balance acidity and alkalinity
- Boron makes glass resistant to heat or chemicals
- Boron prevents corrosion in many settings
- It be used to make advanced materials
- It can be used in materials and coatings to suppress flames
- Boron can be added to steel or aluminum, or used in super-magnets
- It can link alcohols and carbohydrates together in oil recovery
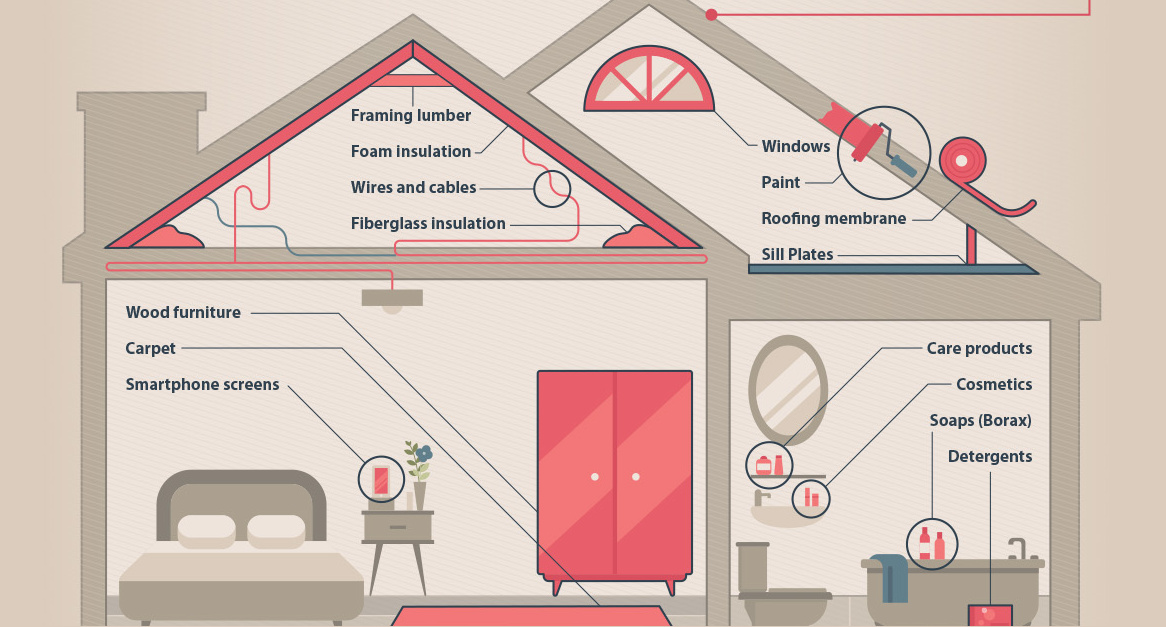
As a result of this vast array of applications, boron is used in everything from smartphone screens to fertilizer.
Small amounts of boron sit in the walls and ceiling of your home, your kitchen, your bathroom, and your driveway – and it’s even in a lot of food since it is an essential micronutrient for plants.
Future Megatrends
There are three megatrends that are driving future boron consumption: urbanization, energy, and agriculture.
Urbanization
By 2025, China will have 221 cities with over 1 million people. Boron is heavily used in cities and buildings, in applications such as glazed ceramics, LCD televisions and electronics, appliances, and textile fiberglass.
Agriculture
Because boron helps regulate the reproductive cycle of plants, it is needed to help maximize food production for a growing population. In India, the use of boron and other micronutrients is being supported by government projects and subsidies to ensure that farmers increase productivity.
Energy
Boron is also used in energy saving applications such as insulation, which will be key as green building practices are encouraged throughout the world. Borates are also used to create the high-powered magnets in applications like wind turbines, making them even more important for a green future.


Lithium
Ranked: The Top 10 EV Battery Manufacturers in 2023
Asia dominates this ranking of the world’s largest EV battery manufacturers in 2023.


The Top 10 EV Battery Manufacturers in 2023
This was originally posted on our Voronoi app. Download the app for free on iOS or Android and discover incredible data-driven charts from a variety of trusted sources.
Despite efforts from the U.S. and EU to secure local domestic supply, all major EV battery manufacturers remain based in Asia.
In this graphic we rank the top 10 EV battery manufacturers by total battery deployment (measured in megawatt-hours) in 2023. The data is from EV Volumes.
Chinese Dominance
Contemporary Amperex Technology Co. Limited (CATL) has swiftly risen in less than a decade to claim the title of the largest global battery group.
The Chinese company now has a 34% share of the market and supplies batteries to a range of made-in-China vehicles, including the Tesla Model Y, SAIC’s MG4/Mulan, and various Li Auto models.
| Company | Country | 2023 Production (megawatt-hour) | Share of Total Production |
|---|---|---|---|
| CATL | 🇨🇳 China | 242,700 | 34% |
| BYD | 🇨🇳 China | 115,917 | 16% |
| LG Energy Solution | 🇰🇷 Korea | 108,487 | 15% |
| Panasonic | 🇯🇵 Japan | 56,560 | 8% |
| SK On | 🇰🇷 Korea | 40,711 | 6% |
| Samsung SDI | 🇰🇷 Korea | 35,703 | 5% |
| CALB | 🇨🇳 China | 23,493 | 3% |
| Farasis Energy | 🇨🇳 China | 16,527 | 2% |
| Envision AESC | 🇨🇳 China | 8,342 | 1% |
| Sunwoda | 🇨🇳 China | 6,979 | 1% |
| Other | - | 56,040 | 8% |
In 2023, BYD surpassed LG Energy Solution to claim second place. This was driven by demand from its own models and growth in third-party deals, including providing batteries for the made-in-Germany Tesla Model Y, Toyota bZ3, Changan UNI-V, Venucia V-Online, as well as several Haval and FAW models.
The top three battery makers (CATL, BYD, LG) collectively account for two-thirds (66%) of total battery deployment.
Once a leader in the EV battery business, Panasonic now holds the fourth position with an 8% market share, down from 9% last year. With its main client, Tesla, now sourcing batteries from multiple suppliers, the Japanese battery maker seems to be losing its competitive edge in the industry.
Overall, the global EV battery market size is projected to grow from $49 billion in 2022 to $98 billion by 2029, according to Fortune Business Insights.

-

 Science1 week ago
Visualizing the Average Lifespans of Mammals
-

 Markets2 weeks ago
The Top 10 States by Real GDP Growth in 2023
-

 Demographics2 weeks ago
The Smallest Gender Wage Gaps in OECD Countries
-

 United States2 weeks ago
Where U.S. Inflation Hit the Hardest in March 2024
-

 Green2 weeks ago
Top Countries By Forest Growth Since 2001
-

 United States2 weeks ago
Ranked: The Largest U.S. Corporations by Number of Employees
-

 Maps2 weeks ago
The Largest Earthquakes in the New York Area (1970-2024)
-

 Green2 weeks ago
Ranked: The Countries With the Most Air Pollution in 2023