Misc
All the Biomass of Earth, in One Graphic


All the Biomass of Earth, in One Graphic
Our planet supports approximately 8.7 million species, of which over a quarter live in water.
But humans can have a hard time comprehending numbers this big, so it can be difficult to really appreciate the breadth of this incredible diversity of life on Earth.
In order to fully grasp this scale, we draw from research by Bar-On et al. to break down the total composition of the living world, in terms of its biomass, and where we fit into this picture.
Why Carbon?
A “carbon-based life form” might sound like something out of science fiction, but that’s what we and all other living things are.
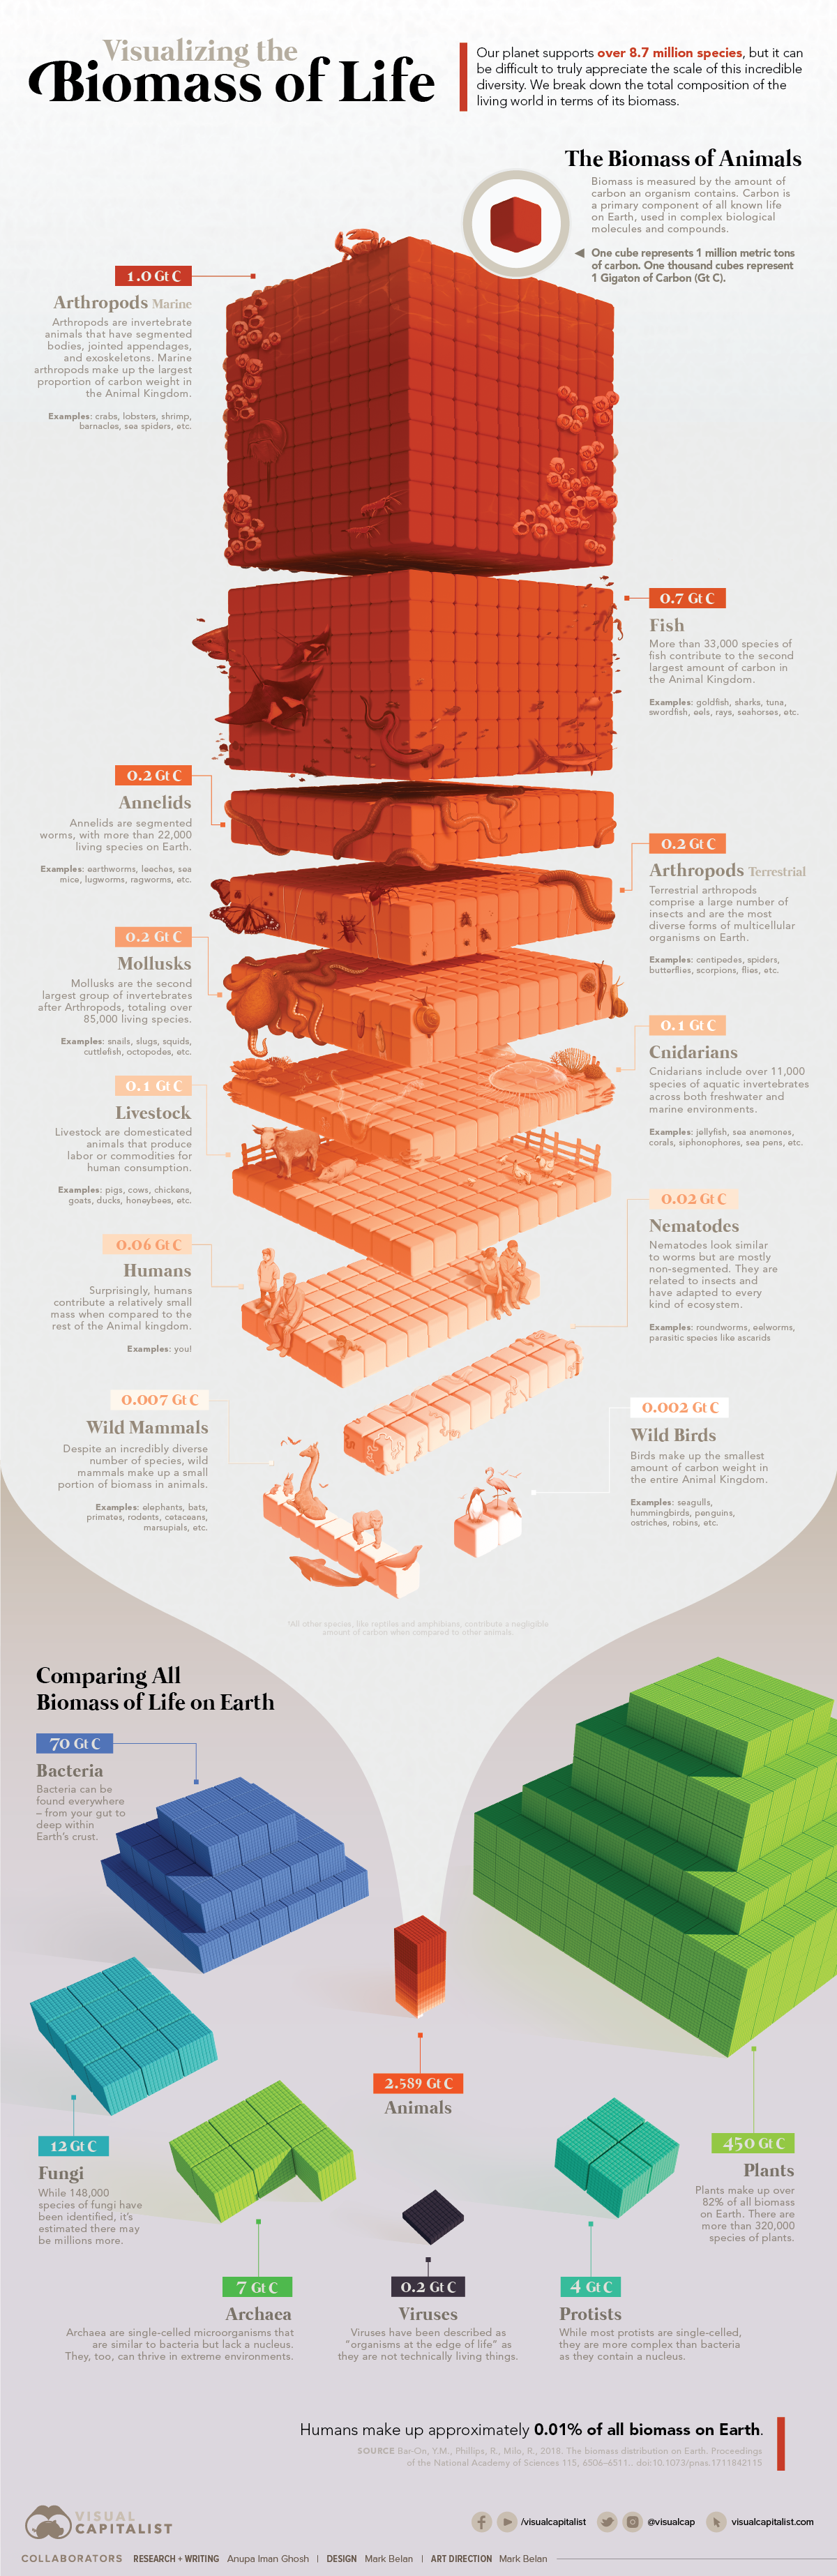
Carbon is used in complex molecules and compounds—making it an essential part of our biology. That’s why biomass, or the mass of organisms, is typically measured in terms of carbon makeup.
In our visualization, one cube represents 1 million metric tons of carbon, and every thousand of these cubes is equal to 1 Gigaton (Gt C).
Here’s how the numbers stack up in terms of biomass of life on Earth:
| Taxon | Mass (Gt C) | % of total |
|---|---|---|
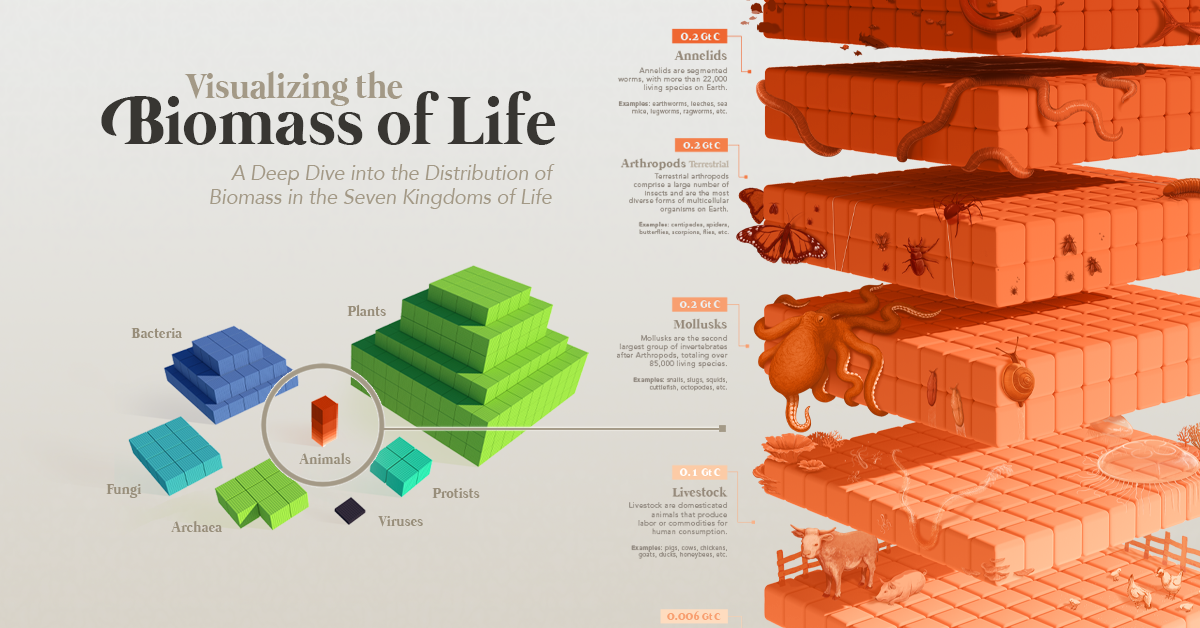
| Plants | 450 | 82.4% |
| Bacteria | 70 | 12.8% |
| Fungi | 12 | 2.2% |
| Archaea | 7 | 1.3% |
| Protists | 4 | 0.70% |
| Animals | 2.589 | 0.47% |
| Viruses | 0.2 | 0.04% |
| Total | 545.8 | 100.0% |
Plants make up the overwhelming majority of biomass on Earth. There are 320,000 species of plants, and their vital photosynthetic processes keep entire ecosystems from falling apart.
Fungi is the third most abundant type of life—and although 148,000 species of fungi have been identified by scientists, it’s estimated there may be millions more.
Animals: A Drop in the Biomass Ocean
Although animals make up only 0.47% of all biomass, there are many sub-categories within them that are worth exploring further.
| Taxon | Mass (Gt C) | % of Animal Biomass |
|---|---|---|
| Arthropods (Marine) | 1.0 | 38.6% |
| Fish | 0.7 | 27.0% |
| Arthropods (Terrestrial) | 0.2 | 7.7% |
| Annelids | 0.2 | 7.7% |
| Mollusks | 0.2 | 7.7% |
| Livestock | 0.1 | 3.9% |
| Cnidarians | 0.1 | 3.9% |
| Humans | 0.06 | 2.3% |
| Nematodes | 0.02 | 0.8% |
| Wild mammals | 0.007 | 0.3% |
| Wild birds | 0.002 | 0.1% |
| Animals (Total) | 2.589 | 100.0% |
Arthropods
Arthropods are the largest group of invertebrates, and include up to 10 million species across insects, arachnids, and crustaceans.
Chordates
The category of chordates includes wild mammals, wild birds, livestock, humans, and fish. Across 65,000 living species in total, nearly half are bony fish like piranhas, salmon, or seahorses.
Surprisingly, humans contribute a relatively small mass compared to the rest of the Animal Kingdom. People make up only 0.01% of all the biomass on the planet.
Annelids, Mollusks, Cnidarians, and Nematodes
Annelids are segmented worms like earthworms or leeches, with over 22,000 living species on this planet. After arthropods, mollusks are the second-largest group of invertebrates with over 85,000 living species. Of these, 80% are snails and slugs.
Cnidarians are a taxon of aquatic invertebrates covering 11,000 species across various marine environments. These include jellyfish, sea anemone, and even corals.
Nematodes are commonly referred to as roundworms. These sturdy critters have successfully adapted to virtually every kind of ecosystem, from polar regions to oceanic trenches. They’ve even survived traveling into space and back.
The Microscopic Rest
Beyond these animals, plants, and fungi, there are an estimated trillion species of microbes invisible to the naked eye—and we’ve probably only discovered 0.001% of them so far.
Bacteria
Bacteria were one of the first life forms to appear on Earth, and classified as prokaryotes (nucleus-less). Today, they’re the second-largest composition of biomass behind plants. Perhaps this is because these organisms can be found living literally everywhere—from your gut to deep in the Earth’s crust.
Researchers at the University of Georgia estimate that there are 5 nonillion bacteria on the planet—that’s a five with 30 zeros after it.
Protists and Archaea
Protists are mostly unicellular, but are more complex than bacteria as they contain a nucleus. They’re also essential components of the food chain.
Archaea are single-celled microorganisms that are similar to bacteria but differ in compositions. They thrive in extreme environments too, from high temperatures above 100°C (212°F) in geysers to extremely saline, acidic, or alkaline conditions.
Viruses
Viruses are the most fascinating category of biomass. They have been described as “organisms at the edge of life,” as they are not technically living things. They’re much smaller than bacteria—however, as the COVID-19 pandemic has shown, their microscopic effects cannot be understated.
The Earth’s Biomass, Under Threat
Human activities are having an ongoing impact on Earth’s biomass.
For example, we’ve lost significant forest cover in the past decades, to make room for agricultural land use and livestock production. One result of this is that biodiversity in virtually every region is on the decline.
Will we be able to reverse this trajectory and preserve the diversity of all the biomass on Earth, before it’s too late?
Editor’s note: This visualization was inspired by the work of Javier Zarracina for Vox from a few years ago. Our aim with the above piece was to recognize that while great communication needs no reinvention, it can be enhanced and reimagined to increase editorial impact and help spread knowledge to an even greater share of the population.


VC+
VC+: Get Our Key Takeaways From the IMF’s World Economic Outlook
A sneak preview of the exclusive VC+ Special Dispatch—your shortcut to understanding IMF’s World Economic Outlook report.

Have you read IMF’s latest World Economic Outlook yet? At a daunting 202 pages, we don’t blame you if it’s still on your to-do list.
But don’t worry, you don’t need to read the whole April release, because we’ve already done the hard work for you.
To save you time and effort, the Visual Capitalist team has compiled a visual analysis of everything you need to know from the report—and our VC+ Special Dispatch is available exclusively to VC+ members. All you need to do is log into the VC+ Archive.
If you’re not already subscribed to VC+, make sure you sign up now to access the full analysis of the IMF report, and more (we release similar deep dives every week).
For now, here’s what VC+ members get to see.
Your Shortcut to Understanding IMF’s World Economic Outlook
With long and short-term growth prospects declining for many countries around the world, this Special Dispatch offers a visual analysis of the key figures and takeaways from the IMF’s report including:
- The global decline in economic growth forecasts
- Real GDP growth and inflation forecasts for major nations in 2024
- When interest rate cuts will happen and interest rate forecasts
- How debt-to-GDP ratios have changed since 2000
- And much more!

Get the Full Breakdown in the Next VC+ Special Dispatch
VC+ members can access the full Special Dispatch by logging into the VC+ Archive, where you can also check out previous releases.
Make sure you join VC+ now to see exclusive charts and the full analysis of key takeaways from IMF’s World Economic Outlook.
Don’t miss out. Become a VC+ member today.
What You Get When You Become a VC+ Member
VC+ is Visual Capitalist’s premium subscription. As a member, you’ll get the following:
- Special Dispatches: Deep dive visual briefings on crucial reports and global trends
- Markets This Month: A snappy summary of the state of the markets and what to look out for
- The Trendline: Weekly curation of the best visualizations from across the globe
- Global Forecast Series: Our flagship annual report that covers everything you need to know related to the economy, markets, geopolitics, and the latest tech trends
- VC+ Archive: Hundreds of previously released VC+ briefings and reports that you’ve been missing out on, all in one dedicated hub
You can get all of the above, and more, by joining VC+ today.

-

 Mining1 week ago
Gold vs. S&P 500: Which Has Grown More Over Five Years?
-

 Markets2 weeks ago
Ranked: The Most Valuable Housing Markets in America
-

 Money2 weeks ago
Which States Have the Highest Minimum Wage in America?
-

 AI2 weeks ago
Ranked: Semiconductor Companies by Industry Revenue Share
-

 Markets2 weeks ago
Ranked: The World’s Top Flight Routes, by Revenue
-

 Countries2 weeks ago
Population Projections: The World’s 6 Largest Countries in 2075
-

 Markets2 weeks ago
The Top 10 States by Real GDP Growth in 2023
-

 Demographics2 weeks ago
The Smallest Gender Wage Gaps in OECD Countries