Markets
Mapped: The Salary Needed to Buy a Home in 50 U.S. Metro Areas
Check out the latest 2023 update of the salary needed to buy a home in the U.S.
The Salary Needed to Buy a Home in 50 U.S. Metro Areas
Check out the latest 2023 update of the salary needed to buy a home in the U.S.
Over the last year, home prices have risen in 49 of the biggest 50 metro areas in the United States.
At the same time, mortgage rates have hit seven-year highs, making things more expensive for any prospective home buyer.
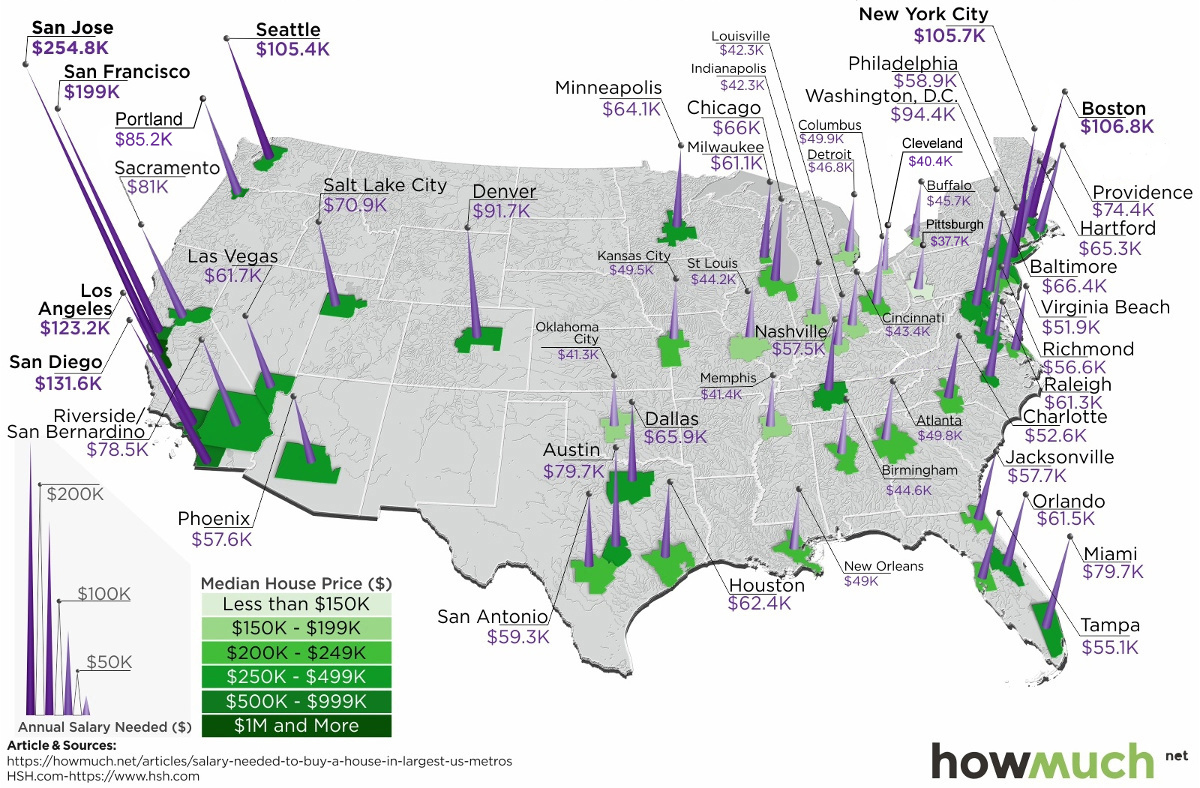
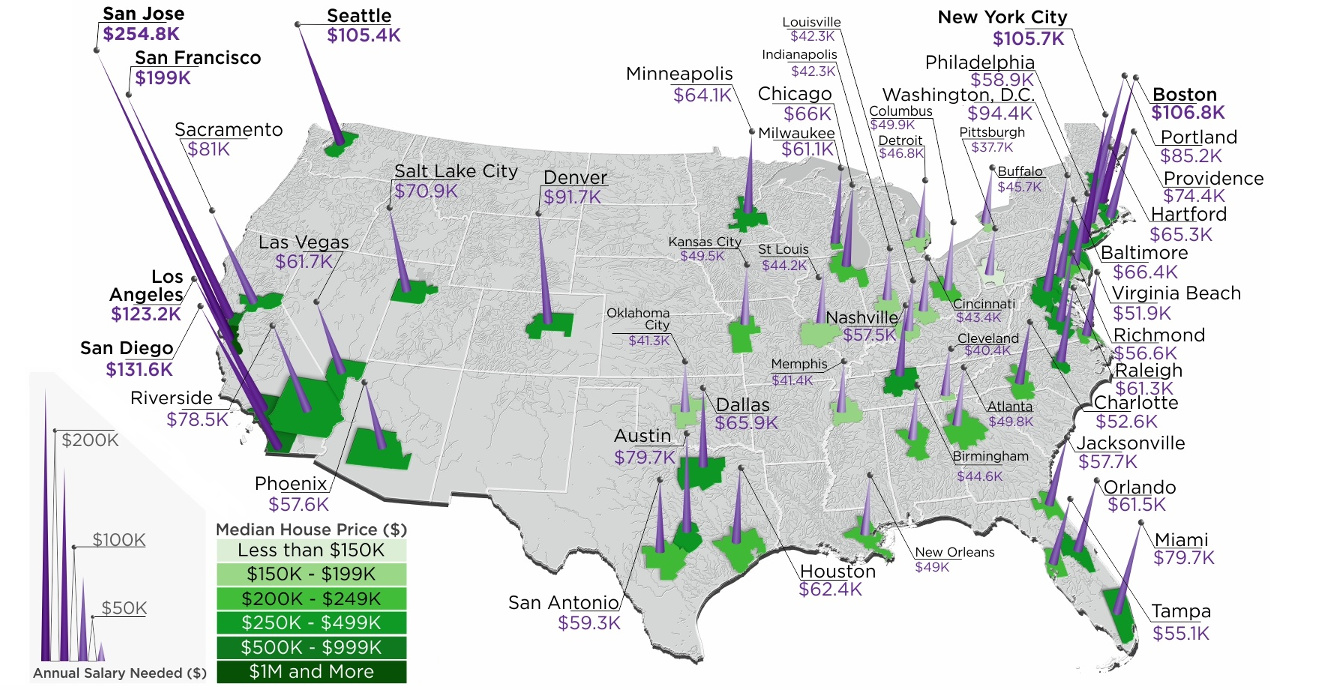
With this context in mind, today’s map comes from HowMuch.net, and it shows the salary needed to buy a home in the 50 largest U.S. metro areas.
The Least and Most Expensive Metro Areas
As a reference point, the median home in the United States costs about $257,600, according to the National Association of Realtors.
| Median Home Price | Montly Payment (PITI) | Salary Needed | |
|---|---|---|---|
| National | $257,600 | $1,433.91 | $61,453.51 |
With a 20% down payment and a 4.90% mortgage rate, and taking into account what’s needed to pay principal, interest, taxes, and insurance (PITI) on the home, it would mean a prospective buyer would need to have $61,453.51 in salary to afford such a purchase.
However, based on your frame of reference, this national estimate may seem extremely low or quite high. That’s because the salary required to buy in different major cities in the U.S. can fall anywhere between $37,659 to $254,835.
The 10 Cheapest Metro Areas
Here are the cheapest metro areas in the U.S., based on data and calculations from HSH.com:
| Rank | Metro Area | Median Home Price | Monthly Payment (PITI) | Salary Needed |
|---|---|---|---|---|
| #1 | Pittsburgh | $141,625 | $878.73 | $37,659.86 |
| #2 | Cleveland | $150,100 | $943.55 | $40,437.72 |
| #3 | Oklahoma City | $161,000 | $964.49 | $41,335.41 |
| #4 | Memphis | $174,000 | $966.02 | $41,400.93 |
| #5 | Indianapolis | $185,200 | $986.74 | $42,288.92 |
| #6 | Louisville | $180,100 | $987.54 | $42,323.15 |
| #7 | Cincinnati | $169,400 | $1,013.37 | $43,429.97 |
| #8 | St. Louis | $174,100 | $1,031.70 | $44,215.56 |
| #9 | Birmingham | $202,300 | $1,040.51 | $44,593.35 |
| #10 | Buffalo | $154,200 | $1,066.29 | $45,698.05 |
After the dust settles, Pittsburgh ranks as the cheapest metro area in the U.S. to buy a home. According to these calculations, buying a median home in Pittsburgh – which includes the surrounding metro area – requires an annual income of less than $40,000 to buy.
Just missing the list was Detroit, where a salary of $48,002.89 is needed.
The 10 Most Expensive Metro Areas
Now, here are the priciest markets in the country, also based on data from HSH.com:
| Rank | Metro Area | Median Home Price | Monthly Payment (PITI) | Salary Needed |
|---|---|---|---|---|
| #1 | San Jose | $1,250,000 | $5,946.17 | $254,835.73 |
| #2 | San Francisco | $952,200 | $4,642.82 | $198,978.01 |
| #3 | San Diego | $626,000 | $3,071.62 | $131,640.79 |
| #4 | Los Angeles | $576,100 | $2,873.64 | $123,156.01 |
| #5 | Boston | $460,300 | $2,491.76 | $106,789.93 |
| #6 | New York City | $403,900 | $2,465.97 | $105,684.33 |
| #7 | Seattle | $489,600 | $2,458.58 | $105,367.89 |
| #8 | Washington, D.C. | $417,400 | $2,202.87 | $94,408.70 |
| #9 | Denver | $438,300 | $2,139.02 | $91,672.45 |
| #10 | Portland | $389,000 | $1,987.37 | $85,173.08 |
Topping the list of the most expensive metro areas are San Jose and San Francisco, which are both cities fueled by the economic boom in Silicon Valley. Meanwhile, two other major metro areas in California, Los Angeles and San Diego, are not far behind.
New York City only ranks in sixth here, though it is worth noting that the NYC metro area extends well beyond the five boroughs. It includes Newark, Jersey City, and many nearby counties as well.
As a final point, it’s worth mentioning that all cities here (with the exception of Denver) are in coastal states.
Notes on Calculations
Data on median home prices comes from the National Association of Realtors and is based on 2018 Q4 information, while national mortgage rate data is derived from weekly surveys by Freddie Mac and the Mortgage Bankers Association of America for 30-year fixed rate mortgages.
Calculations include tax and homeowners insurance costs to determine the annual salary it takes to afford the base cost of owning a home (principal, interest, property tax and homeowner’s insurance, or PITI) in the nation’s 50 largest metropolitan areas.
Standard 28% “front-end” debt ratios and a 20% down payments subtracted from the median-home-price data are used to arrive at these figures.


Markets
The European Stock Market: Attractive Valuations Offer Opportunities
On average, the European stock market has valuations that are nearly 50% lower than U.S. valuations. But how can you access the market?


European Stock Market: Attractive Valuations Offer Opportunities
Europe is known for some established brands, from L’Oréal to Louis Vuitton. However, the European stock market offers additional opportunities that may be lesser known.
The above infographic, sponsored by STOXX, outlines why investors may want to consider European stocks.
Attractive Valuations
Compared to most North American and Asian markets, European stocks offer lower or comparable valuations.
| Index | Price-to-Earnings Ratio | Price-to-Book Ratio |
|---|---|---|
| EURO STOXX 50 | 14.9 | 2.2 |
| STOXX Europe 600 | 14.4 | 2 |
| U.S. | 25.9 | 4.7 |
| Canada | 16.1 | 1.8 |
| Japan | 15.4 | 1.6 |
| Asia Pacific ex. China | 17.1 | 1.8 |
Data as of February 29, 2024. See graphic for full index names. Ratios based on trailing 12 month financials. The price to earnings ratio excludes companies with negative earnings.
On average, European valuations are nearly 50% lower than U.S. valuations, potentially offering an affordable entry point for investors.
Research also shows that lower price ratios have historically led to higher long-term returns.
Market Movements Not Closely Connected
Over the last decade, the European stock market had low-to-moderate correlation with North American and Asian equities.
The below chart shows correlations from February 2014 to February 2024. A value closer to zero indicates low correlation, while a value of one would indicate that two regions are moving in perfect unison.
| EURO STOXX 50 | STOXX EUROPE 600 | U.S. | Canada | Japan | Asia Pacific ex. China |
|
|---|---|---|---|---|---|---|
| EURO STOXX 50 | 1.00 | 0.97 | 0.55 | 0.67 | 0.24 | 0.43 |
| STOXX EUROPE 600 | 1.00 | 0.56 | 0.71 | 0.28 | 0.48 | |
| U.S. | 1.00 | 0.73 | 0.12 | 0.25 | ||
| Canada | 1.00 | 0.22 | 0.40 | |||
| Japan | 1.00 | 0.88 | ||||
| Asia Pacific ex. China | 1.00 |
Data is based on daily USD returns.
European equities had relatively independent market movements from North American and Asian markets. One contributing factor could be the differing sector weights in each market. For instance, technology makes up a quarter of the U.S. market, but health care and industrials dominate the broader European market.
Ultimately, European equities can enhance portfolio diversification and have the potential to mitigate risk for investors.
Tracking the Market
For investors interested in European equities, STOXX offers a variety of flagship indices:
| Index | Description | Market Cap |
|---|---|---|
| STOXX Europe 600 | Pan-regional, broad market | €10.5T |
| STOXX Developed Europe | Pan-regional, broad-market | €9.9T |
| STOXX Europe 600 ESG-X | Pan-regional, broad market, sustainability focus | €9.7T |
| STOXX Europe 50 | Pan-regional, blue-chip | €5.1T |
| EURO STOXX 50 | Eurozone, blue-chip | €3.5T |
Data is as of February 29, 2024. Market cap is free float, which represents the shares that are readily available for public trading on stock exchanges.
The EURO STOXX 50 tracks the Eurozone’s biggest and most traded companies. It also underlies one of the world’s largest ranges of ETFs and mutual funds. As of November 2023, there were €27.3 billion in ETFs and €23.5B in mutual fund assets under management tracking the index.
“For the past 25 years, the EURO STOXX 50 has served as an accurate, reliable and tradable representation of the Eurozone equity market.”
— Axel Lomholt, General Manager at STOXX
Partnering with STOXX to Track the European Stock Market
Are you interested in European equities? STOXX can be a valuable partner:
- Comprehensive, liquid and investable ecosystem
- European heritage, global reach
- Highly sophisticated customization capabilities
- Open architecture approach to using data
- Close partnerships with clients
- Part of ISS STOXX and Deutsche Börse Group
With a full suite of indices, STOXX can help you benchmark against the European stock market.
Learn how STOXX’s European indices offer liquid and effective market access.

-

 Economy1 day ago
Economic Growth Forecasts for G7 and BRICS Countries in 2024
The IMF has released its economic growth forecasts for 2024. How do the G7 and BRICS countries compare?
-

 Markets1 week ago
U.S. Debt Interest Payments Reach $1 Trillion
U.S. debt interest payments have surged past the $1 trillion dollar mark, amid high interest rates and an ever-expanding debt burden.
-

 United States2 weeks ago
Ranked: The Largest U.S. Corporations by Number of Employees
We visualized the top U.S. companies by employees, revealing the massive scale of retailers like Walmart, Target, and Home Depot.
-

 Markets2 weeks ago
The Top 10 States by Real GDP Growth in 2023
This graphic shows the states with the highest real GDP growth rate in 2023, largely propelled by the oil and gas boom.
-

 Markets2 weeks ago
Ranked: The World’s Top Flight Routes, by Revenue
In this graphic, we show the highest earning flight routes globally as air travel continued to rebound in 2023.
-

 Markets2 weeks ago
Ranked: The Most Valuable Housing Markets in America
The U.S. residential real estate market is worth a staggering $47.5 trillion. Here are the most valuable housing markets in the country.

-

 Mining1 week ago
Gold vs. S&P 500: Which Has Grown More Over Five Years?
-
Markets2 weeks ago
Ranked: The Most Valuable Housing Markets in America
-

 Money2 weeks ago
Which States Have the Highest Minimum Wage in America?
-

 AI2 weeks ago
Ranked: Semiconductor Companies by Industry Revenue Share
-
Markets2 weeks ago
Ranked: The World’s Top Flight Routes, by Revenue
-

 Demographics2 weeks ago
Population Projections: The World’s 6 Largest Countries in 2075
-
Markets2 weeks ago
The Top 10 States by Real GDP Growth in 2023
-

 Demographics2 weeks ago
The Smallest Gender Wage Gaps in OECD Countries