Mining
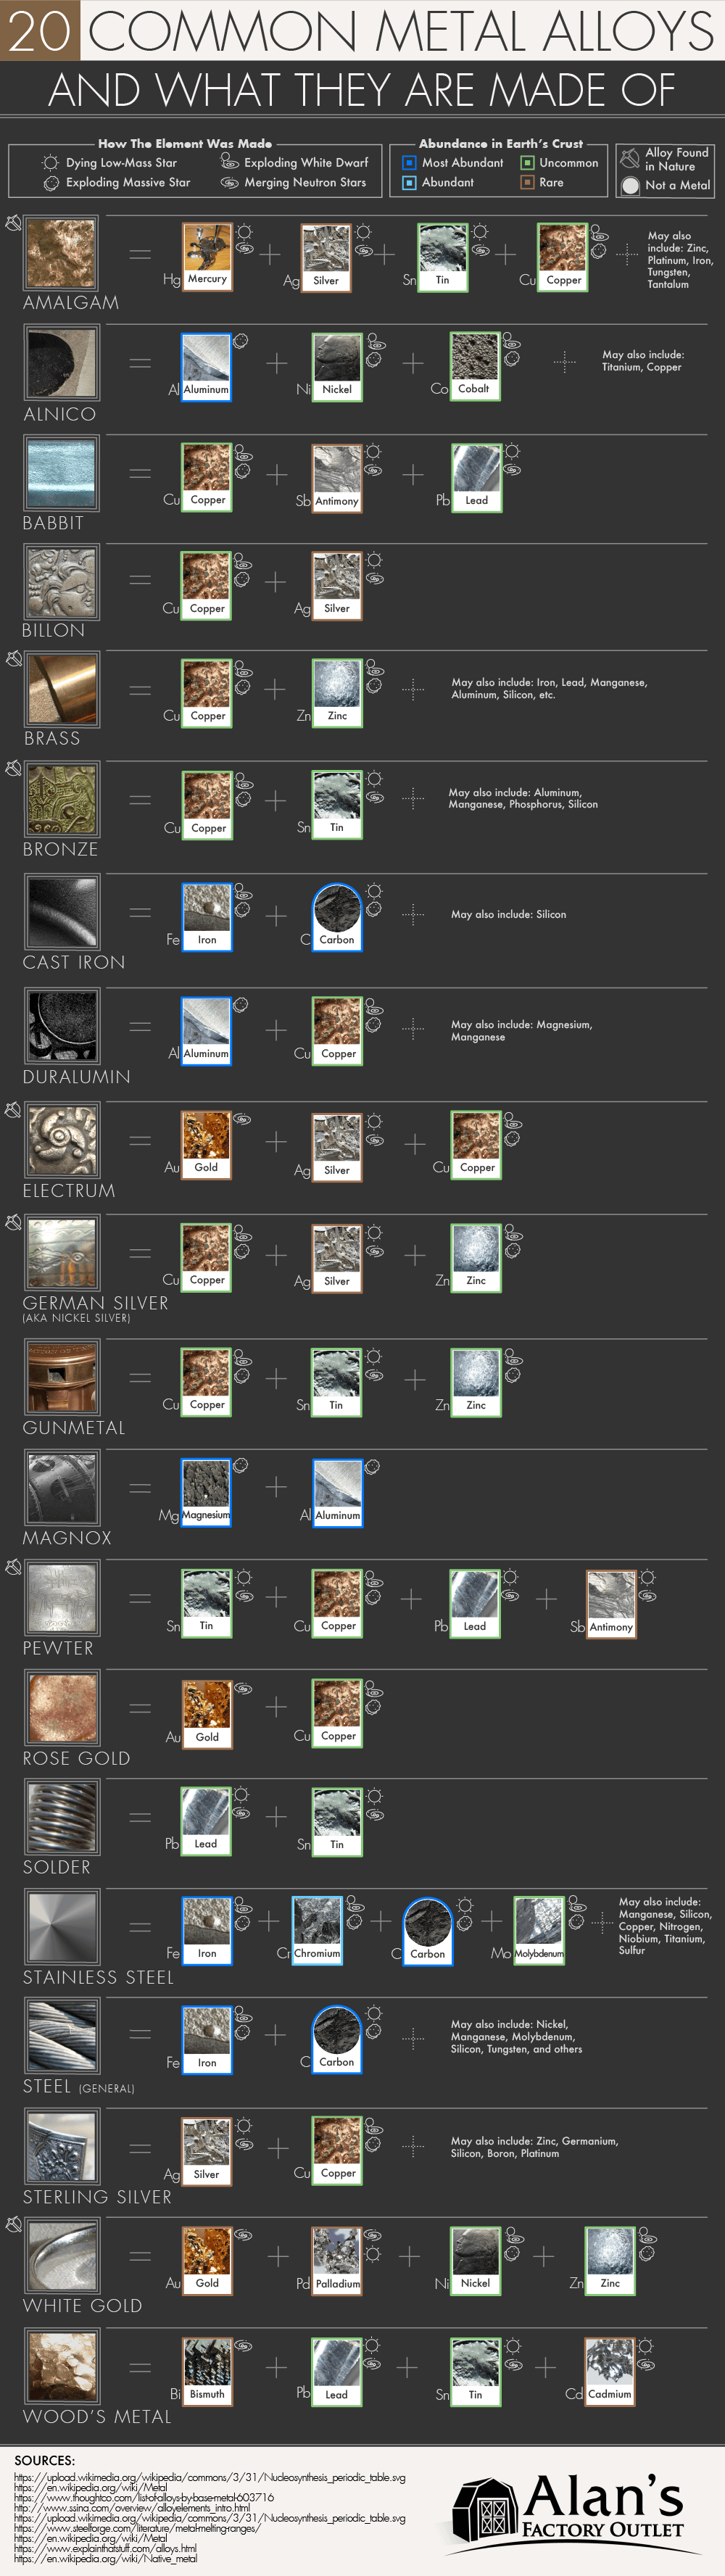
20 Common Metal Alloys and What They’re Made Of
Every day, you’re likely to encounter metals that cannot be found anywhere on the periodic table.
You may play a brass instrument while wearing a white gold necklace – or maybe you cook with a cast iron skillet and store your leftovers in a stainless steel refrigerator.
It’s likely that you know these common metal alloys by name, and you can probably even imagine what they look and feel like. But do you know what base metals these alloys are made of, exactly?
Common Metal Alloys
Today’s infographic comes to us from Alan’s Factory Outlet, and it breaks down metal and non-metal components that go into popular metal alloys.
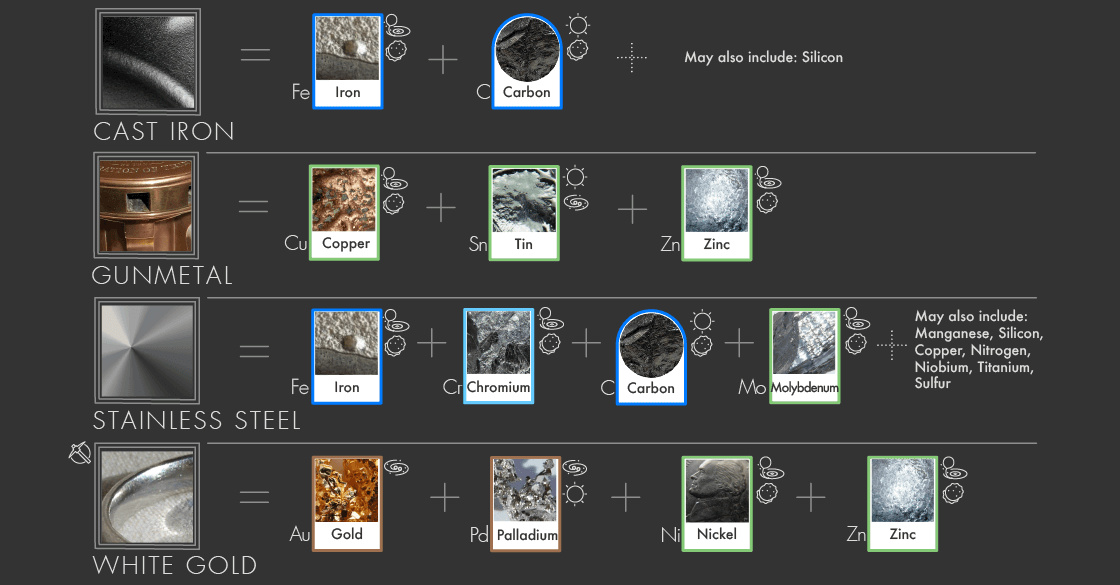
In total, 20 alloys are highlighted, and they range from household names (i.e. bronze, sterling silver) to lesser-known metals that are crucial for industrial purposes (i.e. solder, gunmetal, magnox).
Humans make metal alloys for various reasons.
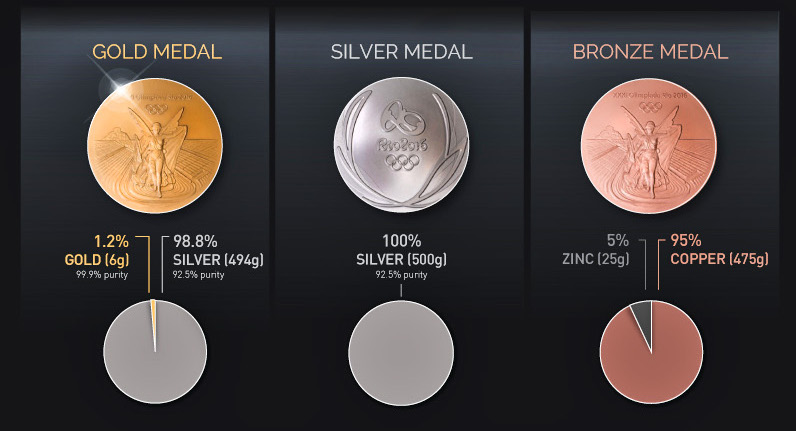
Some alloys have long-standing historical significance. For example, electrum is a naturally-occurring alloy of gold and silver (with trace amounts of copper) that was used to make the very first metal coins in ancient history.
However, most of the common metal alloys on the above list are actually human inventions that are used to achieve practical purposes. Some were innovated by brilliant metallurgists, while others were discovered by fluke, but they’ve all had an ongoing impact on our species over time.
Alloys with an Impact
The Bronze Age (3,000 BC – 1,200 BC) is an important historical period that is rightfully named after one game-changing development: the ability to use bronze. This alloy, made from copper and tin, was extremely useful to our ancestors because it is much stronger and harder than its component metals.
Steel is another great example of an alloy that has changed the world. It is one of the most important and widely-used metals today. Without steel, modern civilization (skyscrapers, bridges, etc.) simply wouldn’t be possible.
While nobody knows exactly who invented steel, the alloy has a widely-known cousin that was likely invented in somewhat accidental circumstances.
In 1912, English metallurgist Harry Brearley had been tasked with finding a more erosion-resistant steel for a small arms manufacturer, trying many variations of alloys with none seeming to be suitable. However, in his scrap metal heap – where almost all of the metals he tried were rusting – there was one gun barrel that remained astonishingly untouched.
The metal alloy – now known to the world as stainless steel – was a step forward in creating a corrosion-resistant steel that is now used in many applications ranging from medical uses to heavy industry.

Lithium
Ranked: The Top 10 EV Battery Manufacturers in 2023
Asia dominates this ranking of the world’s largest EV battery manufacturers in 2023.


The Top 10 EV Battery Manufacturers in 2023
This was originally posted on our Voronoi app. Download the app for free on iOS or Android and discover incredible data-driven charts from a variety of trusted sources.
Despite efforts from the U.S. and EU to secure local domestic supply, all major EV battery manufacturers remain based in Asia.
In this graphic we rank the top 10 EV battery manufacturers by total battery deployment (measured in megawatt-hours) in 2023. The data is from EV Volumes.
Chinese Dominance
Contemporary Amperex Technology Co. Limited (CATL) has swiftly risen in less than a decade to claim the title of the largest global battery group.
The Chinese company now has a 34% share of the market and supplies batteries to a range of made-in-China vehicles, including the Tesla Model Y, SAIC’s MG4/Mulan, and various Li Auto models.
| Company | Country | 2023 Production (megawatt-hour) | Share of Total Production |
|---|---|---|---|
| CATL | 🇨🇳 China | 242,700 | 34% |
| BYD | 🇨🇳 China | 115,917 | 16% |
| LG Energy Solution | 🇰🇷 Korea | 108,487 | 15% |
| Panasonic | 🇯🇵 Japan | 56,560 | 8% |
| SK On | 🇰🇷 Korea | 40,711 | 6% |
| Samsung SDI | 🇰🇷 Korea | 35,703 | 5% |
| CALB | 🇨🇳 China | 23,493 | 3% |
| Farasis Energy | 🇨🇳 China | 16,527 | 2% |
| Envision AESC | 🇨🇳 China | 8,342 | 1% |
| Sunwoda | 🇨🇳 China | 6,979 | 1% |
| Other | - | 56,040 | 8% |
In 2023, BYD surpassed LG Energy Solution to claim second place. This was driven by demand from its own models and growth in third-party deals, including providing batteries for the made-in-Germany Tesla Model Y, Toyota bZ3, Changan UNI-V, Venucia V-Online, as well as several Haval and FAW models.
The top three battery makers (CATL, BYD, LG) collectively account for two-thirds (66%) of total battery deployment.
Once a leader in the EV battery business, Panasonic now holds the fourth position with an 8% market share, down from 9% last year. With its main client, Tesla, now sourcing batteries from multiple suppliers, the Japanese battery maker seems to be losing its competitive edge in the industry.
Overall, the global EV battery market size is projected to grow from $49 billion in 2022 to $98 billion by 2029, according to Fortune Business Insights.

-

 Science1 week ago
Visualizing the Average Lifespans of Mammals
-

 Markets2 weeks ago
The Top 10 States by Real GDP Growth in 2023
-

 Demographics2 weeks ago
The Smallest Gender Wage Gaps in OECD Countries
-

 United States2 weeks ago
Where U.S. Inflation Hit the Hardest in March 2024
-

 Green2 weeks ago
Top Countries By Forest Growth Since 2001
-

 United States2 weeks ago
Ranked: The Largest U.S. Corporations by Number of Employees
-

 Maps2 weeks ago
The Largest Earthquakes in the New York Area (1970-2024)
-

 Green2 weeks ago
Ranked: The Countries With the Most Air Pollution in 2023