Mining
How AI and Big Data Will Unlock the Next Wave of Mineral Discoveries

How AI and Big Data Will Unlock the Next Mineral Discovery
Emerging technologies such as artificial intelligence (AI) and machine learning are rapidly proving their value across many industries.
Today’s infographic comes from GoldSpot Discoveries, and it shows that when this tech is applied to massive geological data sets, that there is growing potential to unlock the next wave of mineral discoveries.
Mineral Exploration: Fortunes Go to the Few
Discovering new sources of minerals, such as copper, gold, or even cobalt, can be notoriously difficult but also very rewarding. According to Goldspot, the chance of finding a new deposit is around 0.5%, with odds improving to 5% if exploration takes place near a known resource.
On the whole, mineral exploration has not been a winning prospect if you compare the total dollar spend and the actual value of the resulting discoveries.
Measuring Discovery Performance by Region (2005 to 2014)
| Region | Exploration Spend | Estimated Value of Discoveries | Value/Spend ratio |
|---|---|---|---|
| Australia | $13 billion | $13 billion | 0.97 |
| Canada | $25 billion | $19 billion | 0.77 |
| USA | $10 billion | $5 billion | 0.48 |
| Latin America | $33 billion | $19 billion | 0.57 |
| Pacific/SE Asia | $8 billion | $4 billion | 0.49 |
| Africa | $20 billion | $23 billion | 1.19 |
| Western Europe | $4 billion | $2 billion | 0.42 |
| Rest of World | $27 billion | $8 billion | 0.32 |
| Total | $140 billion | $93 billion | 0.57 |
Figures in 2014 dollars. (Source: MinEx Consulting, March 2015)
Aside from the geographic insights, on the surface this data reveals that mineral exploration does not pay for itself. That said, there are still significant discoveries worth billions of dollars – it’s just the returns go inordinately to a few small players that make big finds.
Much of the money spent on exploration may not have produced the next great discovery, but you can be sure it created massive volumes of data that could be used for further refining of exploration models.
So, What is the Problem?
Every exploration failure or success produces geological insights. The mineral exploration process is the source of massive amounts of data in the form of soil samples, chip samples, geochemistry, drill results, and assay results. Each drill hole is a tiny snapshot into the processes that form the earth.
A single drill hole can create 200 megabytes of data and when there are many drill holes coupled with other types of information, an exploration project can produce terabytes of data. If you wanted to compare your one project to hundreds of others to find the best insights, the amount of data becomes dizzying.
All these data points are clues that can be used to find new mineral deposits, but to sort through them is too much for even an entire team of capable geologists.
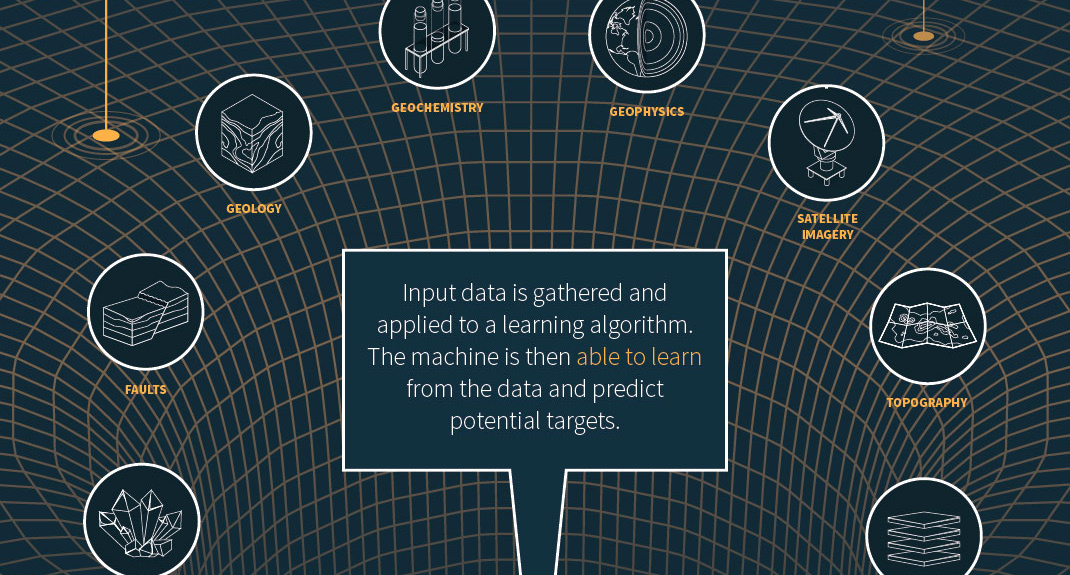
Luckily, using today’s technology, this data can now be used to train computers to spot the areas showing similar patterns to past discoveries.
AI-Assistance
The true power of AI will be in its ability to empower technically trained professionals to make decisions in an increasingly complex and data-driven world.
Professor Ajay Agrawal, a noted academic in AI and founder of the University of Toronto’s Creative Destruction Lab, categorizes human activities into five categories:
- Data collection
- Information retrieval
- Prediction
- Judgment
- Action
He concludes that machines should do the first three and that humans – such as geologists, doctors, lawyers, investment bankers and others – should make the judgment calls and take the actions based on predictive capabilities of AI.
The mineral exploration industry presents a good example of how AI and big data can help technical professionals make discoveries faster, with less money, using a wide variety of data inputs created.
Opportunity Generator and the AI-friendly Future
AI can take the large amounts of data from many different projects in order to spot the right opportunities to further explore, building on decades of geological data from projects around the world.
The right technology can help reduce the risk inherent in exploration and lead to more mineral discoveries on budget, rewarding those that deployed their data most effectively. Companies that are able to harness this power will tip the scales in their favor.
As a result, mineral exploration is no longer so much an art of interpretation – but instead, it becomes closer to a pure science, giving geologists a whole-field perspective of all the data.


Lithium
Ranked: The Top 10 EV Battery Manufacturers in 2023
Asia dominates this ranking of the world’s largest EV battery manufacturers in 2023.


The Top 10 EV Battery Manufacturers in 2023
This was originally posted on our Voronoi app. Download the app for free on iOS or Android and discover incredible data-driven charts from a variety of trusted sources.
Despite efforts from the U.S. and EU to secure local domestic supply, all major EV battery manufacturers remain based in Asia.
In this graphic we rank the top 10 EV battery manufacturers by total battery deployment (measured in megawatt-hours) in 2023. The data is from EV Volumes.
Chinese Dominance
Contemporary Amperex Technology Co. Limited (CATL) has swiftly risen in less than a decade to claim the title of the largest global battery group.
The Chinese company now has a 34% share of the market and supplies batteries to a range of made-in-China vehicles, including the Tesla Model Y, SAIC’s MG4/Mulan, and various Li Auto models.
| Company | Country | 2023 Production (megawatt-hour) | Share of Total Production |
|---|---|---|---|
| CATL | 🇨🇳 China | 242,700 | 34% |
| BYD | 🇨🇳 China | 115,917 | 16% |
| LG Energy Solution | 🇰🇷 Korea | 108,487 | 15% |
| Panasonic | 🇯🇵 Japan | 56,560 | 8% |
| SK On | 🇰🇷 Korea | 40,711 | 6% |
| Samsung SDI | 🇰🇷 Korea | 35,703 | 5% |
| CALB | 🇨🇳 China | 23,493 | 3% |
| Farasis Energy | 🇨🇳 China | 16,527 | 2% |
| Envision AESC | 🇨🇳 China | 8,342 | 1% |
| Sunwoda | 🇨🇳 China | 6,979 | 1% |
| Other | - | 56,040 | 8% |
In 2023, BYD surpassed LG Energy Solution to claim second place. This was driven by demand from its own models and growth in third-party deals, including providing batteries for the made-in-Germany Tesla Model Y, Toyota bZ3, Changan UNI-V, Venucia V-Online, as well as several Haval and FAW models.
The top three battery makers (CATL, BYD, LG) collectively account for two-thirds (66%) of total battery deployment.
Once a leader in the EV battery business, Panasonic now holds the fourth position with an 8% market share, down from 9% last year. With its main client, Tesla, now sourcing batteries from multiple suppliers, the Japanese battery maker seems to be losing its competitive edge in the industry.
Overall, the global EV battery market size is projected to grow from $49 billion in 2022 to $98 billion by 2029, according to Fortune Business Insights.

-

 Lithium7 days ago
Ranked: The Top 10 EV Battery Manufacturers in 2023
-

 Green2 weeks ago
Top Countries By Forest Growth Since 2001
-

 United States2 weeks ago
Ranked: The Largest U.S. Corporations by Number of Employees
-

 Maps2 weeks ago
The Largest Earthquakes in the New York Area (1970-2024)
-

 Green2 weeks ago
Ranked: The Countries With the Most Air Pollution in 2023
-

 Green2 weeks ago
Ranking the Top 15 Countries by Carbon Tax Revenue
-

 Markets2 weeks ago
U.S. Debt Interest Payments Reach $1 Trillion
-

 Mining2 weeks ago
Gold vs. S&P 500: Which Has Grown More Over Five Years?