Mining
11 Things Every Metal Investor Needs to Know About Zinc
Certain commodities tend to fly under the radar for periods of time.
For example, it was only in the last couple of years that markets have been able to digest the potential impact of the electric vehicle boom, and what it may mean for raw materials. The lithium, graphite, and cobalt prices reacted accordingly, and suddenly these essential ingredients for lithium-ion batteries were hot commodities.
Another one of those metals that comes and goes is zinc – and after shooting up in price over 35% this year, it definitely has the attention of many investors and speculators again.
Re-Thinking Zinc
Today’s infographic comes to us from Pistol Bay Mining, a company that is too focusing on zinc, and it highlights 11 things that investors need to know about a metal that is gaining substantial momentum.
Here’s why the metal is back in fashion:
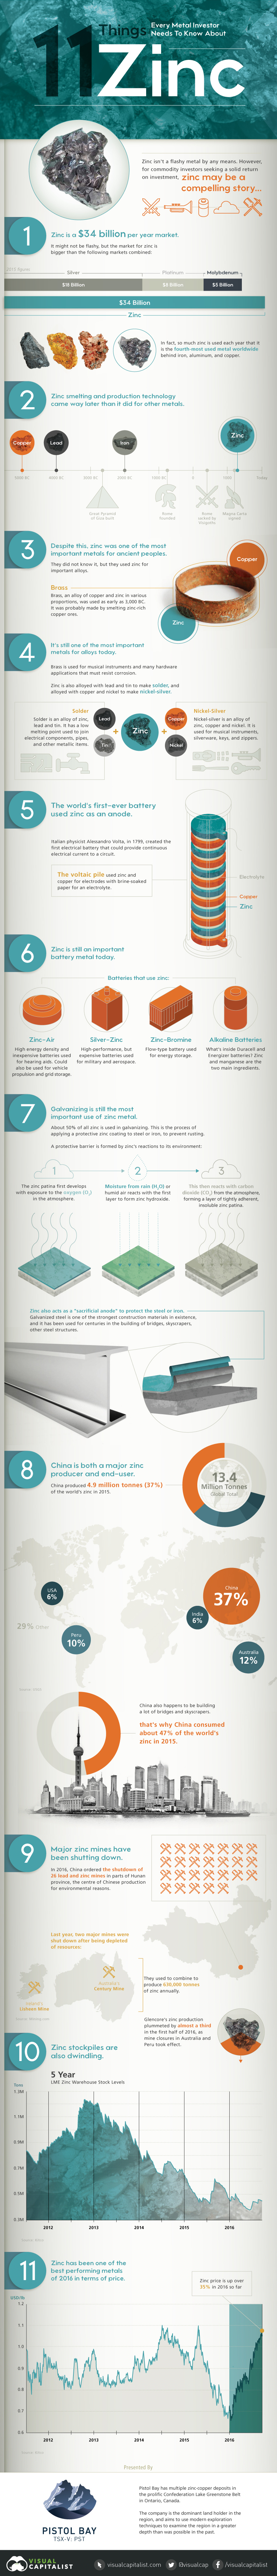
1. Zinc is a $34 billion per year market.
It’s bigger than the silver ($18 billion), platinum ($8 billion), and molybdenum ($5 billion) markets combined. In fact, it is the fourth-most used metal worldwide.
2. Zinc smelting and production technology came way later than it did for other metals.
The ancients were able to smelt copper, lead, and iron, but it wasn’t until much later that people were able to work with zinc in any isolated state.
3. Even despite this, it was a crucial metal for ancient peoples.
They would smelt zinc-rich copper ores to make brass, which was used for many different purposes including weaponry, ornaments, coins, and armor.
4. Zinc is also crucial to produce many alloys today.
For example, brass is used for musical instruments and hardware applications that must resist corrosion. Solder and nickel-silver are other important alloys.
5. The world’s first-ever battery used zinc as an anode.
The voltaic pile, made in 1799 by Alessandro Volta, used zinc and copper for electrodes with brine-soaked paper as an electrolyte.
6. The metal remains crucial for batteries today.
Zinc-air, silver-zinc, zinc-bromine, and alkaline batteries all use zinc, and they enable everything from hearing aids to military applications to be possible.
7. Galvanizing is still the most important use.
About 50% of the metal is used in galvanizing, which is essentially a way to coat steel or iron so that it doesn’t rust.
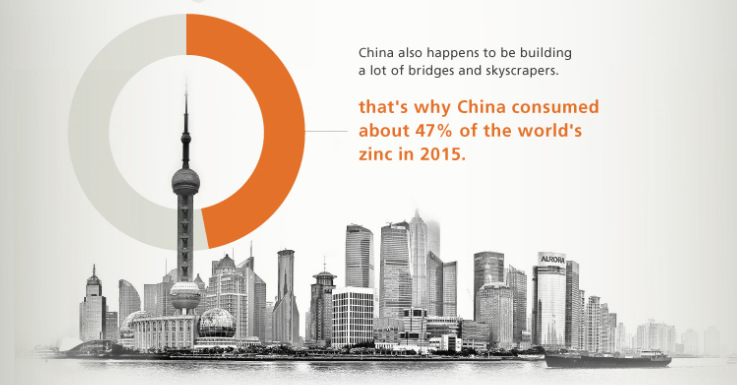
8. China is both a major producer and end-user.
China mined 37% of the world’s 13.4 million tonnes of zinc production in 2015. It consumed 47% of the world’s supply that same year.
9. Major mines have been shutting down.
In 2016, China ordered the shutdown of 26 lead and zinc mines in parts of the Hunan province for environmental reasons. Meanwhile, Ireland’s Lisheen Mine and Australia’s Century Mine both shut down last year after being depleted of resources. That takes 630,000 tonnes of annual production off the table.
10. Stockpiles are dwindling.
Warehouse levels are less than half of where they were in 2013.
11. Zinc has been one of the best performing metals in 2016 in terms of price.
It started the year around $0.70/lb, but now it trades for $1.04/lb.


Mining
Charted: The Value Gap Between the Gold Price and Gold Miners
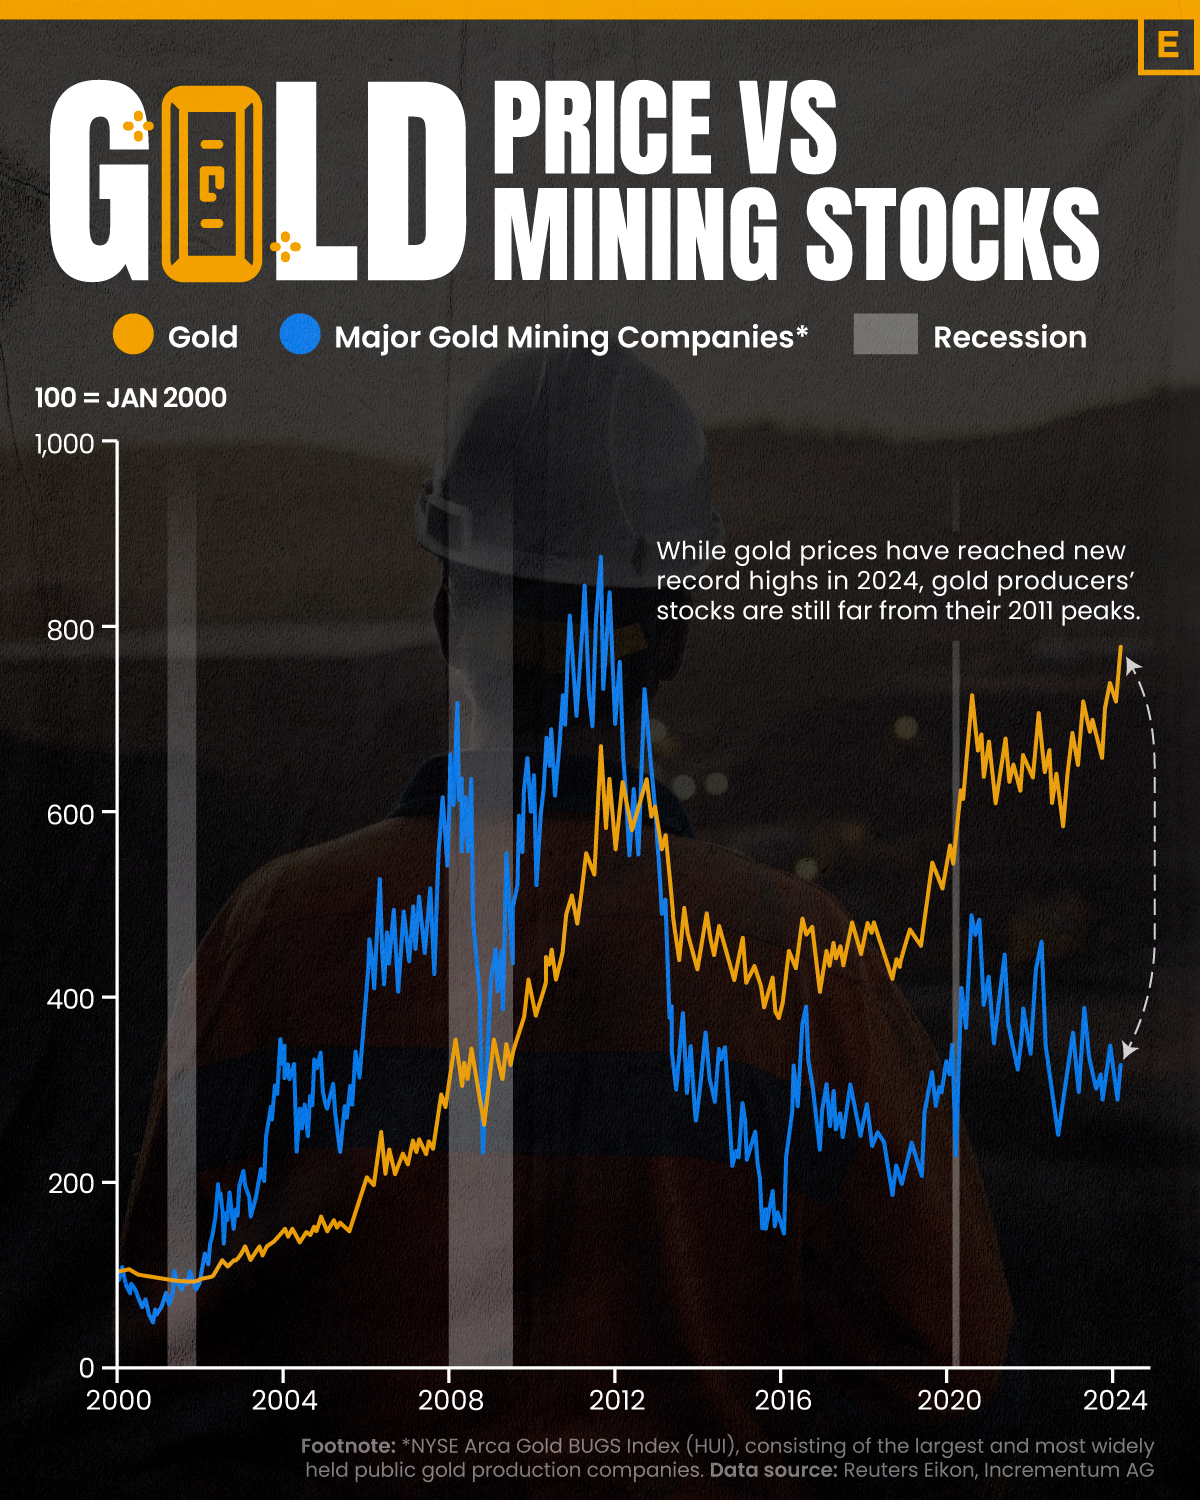
While the price of gold has reached new record highs in 2024, gold mining stocks are still far from their 2011 peaks.
The Value Gap Between the Gold Price and Gold Miners
This was originally posted on our Voronoi app. Download the app for free on Apple or Android and discover incredible data-driven charts from a variety of trusted sources.
Although the price of gold has reached new record highs in 2024, gold miners are still far from their 2011 peaks.
In this graphic, we illustrate the evolution of gold prices since 2000 compared to the NYSE Arca Gold BUGS Index (HUI), which consists of the largest and most widely held public gold production companies. The data was compiled by Incrementum AG.
Mining Stocks Lag Far Behind
In April 2024, gold reached a new record high as Federal Reserve Chair Jerome Powell signaled policymakers may delay interest rate cuts until clearer signs of declining inflation materialize.
Additionally, with elections occurring in more than 60 countries in 2024 and ongoing conflicts in Ukraine and Gaza, central banks are continuing to buy gold to strengthen their reserves, creating momentum for the metal.
Traditionally known as a hedge against inflation and a safe haven during times of political and economic uncertainty, gold has climbed over 11% so far this year.
According to Business Insider, gold miners experienced their best performance in a year in March 2024. During that month, the gold mining sector outperformed all other U.S. industries, surpassing even the performance of semiconductor stocks.
Still, physical gold has outperformed shares of gold-mining companies over the past three years by one of the largest margins in decades.
| Year | Gold Price | NYSE Arca Gold BUGS Index (HUI) |
|---|---|---|
| 2023 | $2,062.92 | $243.31 |
| 2022 | $1,824.32 | $229.75 |
| 2021 | $1,828.60 | $258.87 |
| 2020 | $1,895.10 | $299.64 |
| 2019 | $1,523.00 | $241.94 |
| 2018 | $1,281.65 | $160.58 |
| 2017 | $1,296.50 | $192.31 |
| 2016 | $1,151.70 | $182.31 |
| 2015 | $1,060.20 | $111.18 |
| 2014 | $1,199.25 | $164.03 |
| 2013 | $1,201.50 | $197.70 |
| 2012 | $1,664.00 | $444.22 |
| 2011 | $1,574.50 | $498.73 |
| 2010 | $1,410.25 | $573.32 |
| 2009 | $1,104.00 | $429.91 |
| 2008 | $865.00 | $302.41 |
| 2007 | $836.50 | $409.37 |
| 2006 | $635.70 | $338.24 |
| 2005 | $513.00 | $276.90 |
| 2004 | $438.00 | $215.33 |
| 2003 | $417.25 | $242.93 |
| 2002 | $342.75 | $145.12 |
| 2001 | $276.50 | $65.20 |
| 2000 | $272.65 | $40.97 |
Among the largest companies on the NYSE Arca Gold BUGS Index, Colorado-based Newmont has experienced a 24% drop in its share price over the past year. Similarly, Canadian Barrick Gold also saw a decline of 6.5% over the past 12 months.

-

 Technology2 weeks ago
Ranked: The Most Popular Smartphone Brands in the U.S.
-

 Automotive1 week ago
Almost Every EV Stock is Down After Q1 2024
-

 Money1 week ago
Where Does One U.S. Tax Dollar Go?
-

 Green2 weeks ago
Ranked: Top Countries by Total Forest Loss Since 2001
-

 Real Estate2 weeks ago
Visualizing America’s Shortage of Affordable Homes
-

 Maps2 weeks ago
Mapped: Average Wages Across Europe
-

 Mining2 weeks ago
Charted: The Value Gap Between the Gold Price and Gold Miners
-

 Demographics2 weeks ago
Visualizing the Size of the Global Senior Population