Misc
What Does the Average Rent Get You in These U.S. Cities?
What Does the Average Rent Get You in These U.S. Cities?
Housing markets in general are linked to a variety of national variables: interest rates, unemployment, mortgage availability, consumer confidence, inflation, and overall economic health. However, they can also be extremely regional in nature, and this is why there can be such variations in domestic prices.
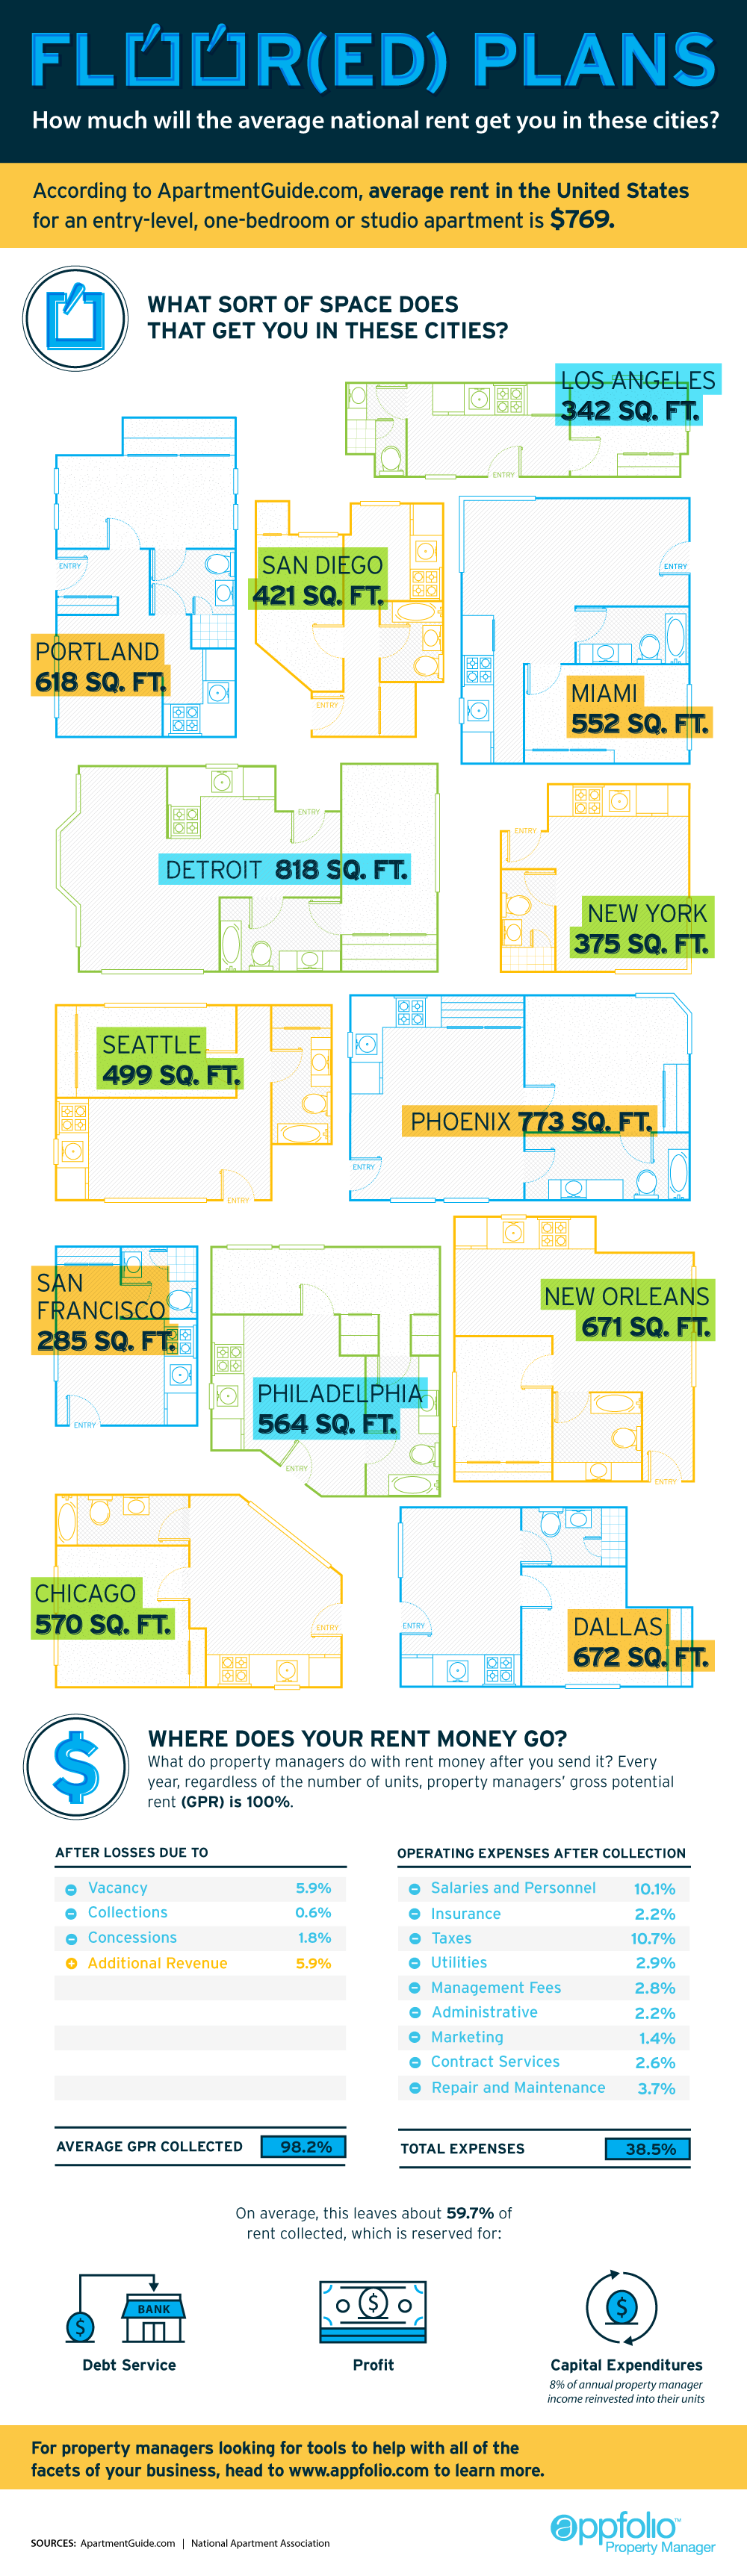
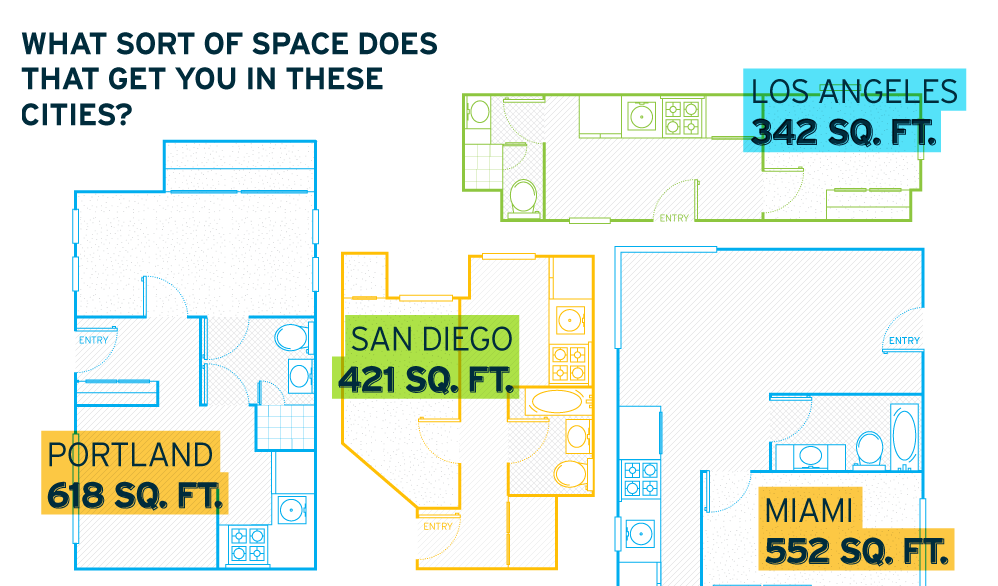
Even though Canada still takes claim for the most overvalued housing market in the world, there are parts of America that look just as bubbly. This infographic looks at what renters could get in various cities while paying the average national monthly rent for an entry-level, one-bedroom or studio apartment ($769).
The results vary.
In Detroit, a city still emerging from its bankruptcy troubles, a renter could get 818 sq. ft. of space for the average rent. There is still some value in Chicago, Miami, and New Orleans, where the average national rent gets places of 570, 552, and 671 sq. ft. respectively.
In the Big Apple, it is understandable that housing is hard to come by. The average amount can only get 375 sq. ft.
However, where things really break down is in the Golden State, specifically in the Bay Area. New renters in San Francisco will find that the average national rent is only enough to get a kitchen and maybe a bathroom with just 285 sq. ft of space. Things are so bad in the city that shipping containers are getting converted to small homes and being rented out illegally for $1,000 per month. Someone even pitched a tent in their garden in Mountainview and listed it for $899 per month.
The fuel for San Francisco’s housing woes lies in the influx of high-paying tech companies and jobs in Silicon Valley, foreign home buyers bidding up prices, complicated housing and renting regulations, lack of general supply, and stifling bureaucracy.
Original graphic by: Mashable


United States
Visualizing the Most Common Pets in the U.S.
Lions, tigers, and bears, oh my!—these animals do not feature on this list of popular American household pets.


Visualizing The Most Common Pets in the U.S.
This was originally posted on our Voronoi app. Download the app for free on iOS or Android and discover incredible data-driven charts from a variety of trusted sources.
In this graphic, we visualized the most common American household pets, based on 2023-2024 data from the American Pet Products Association (accessed via Forbes Advisor).
Figures represent the number of households that own each pet type, rather than the actual number of each animal. The “small animal” category includes hamsters, gerbils, rabbits, guinea pigs, chinchillas, mice, rats, and ferrets.
What is the Most Popular American Household Pet?
Based on this data, dogs—one of the first domesticated animals—are the most common pets in the United States. In fact, around 65 million households own a dog, and spend an average of $900 a year on their care.
| Rank | Species | Households |
|---|---|---|
| 1 | 🐶 Dog | 65M |
| 2 | 🐱 Cat | 47M |
| 3 | 🐟 Freshwater Fish | 11M |
| 4 | 🐰 Small Animals | 7M |
| 5 | 🐦 Bird | 6M |
| 6 | 🦎 Reptile | 6M |
| 7 | 🐴 Horse | 2M |
| 8 | 🐠 Saltwater Fish | 2M |
Note: Households can own multiple pets, and are counted for all relevant categories.
Cats rank second, at 47 million households, and these smaller felines are a little less expensive to own at $700/year according to Forbes estimates.
But aside from these two juggernauts, there are plenty of other common pet types found in households across the country.
Freshwater fish can be found in 11 million households, along with small animals—rabbits, hamsters, guinea pigs—in 7 million. Meanwhile, nearly 6 million homes have birds or reptiles.
Pet Ownership is on the Rise in America
Forbes found that 66% of all American households (numbering 87 million) own at least one pet, up from 56% in 1988. One third of these (29 million) own multiple pets.
A combination of factors is driving this increase: rising incomes, delayed childbirth, and of course the impact of the pandemic which nearly cleared out animal shelters across the globe.
America’s loneliness epidemic may also be a factor. Fledgling research has shown that single-individual households with pets recorded lower rates of loneliness during the pandemic than those without a pet.

-

 Demographics1 week ago
The Countries That Have Become Sadder Since 2010
-

 Green2 weeks ago
Ranked: The Countries With the Most Air Pollution in 2023
-

 Green2 weeks ago
Ranking the Top 15 Countries by Carbon Tax Revenue
-

 Markets2 weeks ago
U.S. Debt Interest Payments Reach $1 Trillion
-

 Mining2 weeks ago
Gold vs. S&P 500: Which Has Grown More Over Five Years?
-

 Energy2 weeks ago
The World’s Biggest Nuclear Energy Producers
-

 Misc2 weeks ago
How Hard Is It to Get Into an Ivy League School?
-

 Debt2 weeks ago
How Debt-to-GDP Ratios Have Changed Since 2000