Misc
Mercator Misconceptions: Clever Map Shows the True Size of Countries
This Clever Map Shows the True Size of Countries
Maps are hugely important tools in our everyday life, whether it’s guiding our journeys from point A to B, or shaping our big picture perceptions about geopolitics and the environment.
For many people, the Earth as they know it is heavily informed by the Mercator projection—a tool used for nautical navigation that eventually became the world’s most widely recognized map.
Mercator’s Rise to the Top
With any map projection style, the big challenge lies in depicting a spherical object as a 2D graphic. There are various trade-offs with any map style, and those trade-offs can vary depending on how the map is meant to be used.
In 1569, the great cartographer, Gerardus Mercator, created a revolutionary new map based on a cylindrical projection. The new map was well-suited to nautical navigation since every line on the sphere is a constant course, or loxodrome.
Geographic Inflation
The vast majority of us aren’t using paper maps to chart our course across the ocean anymore, so critics of the Mercator projection argue that the continued use of this style of map gives users a warped sense of the true size of countries—particularly in the case of the African continent.
Mercator’s map inadvertently also pumps up the sizes of Europe and North America. Visually speaking, Canada and Russia appear to take up approximately 25% of the Earth’s surface, when in reality they occupy a mere 5%.
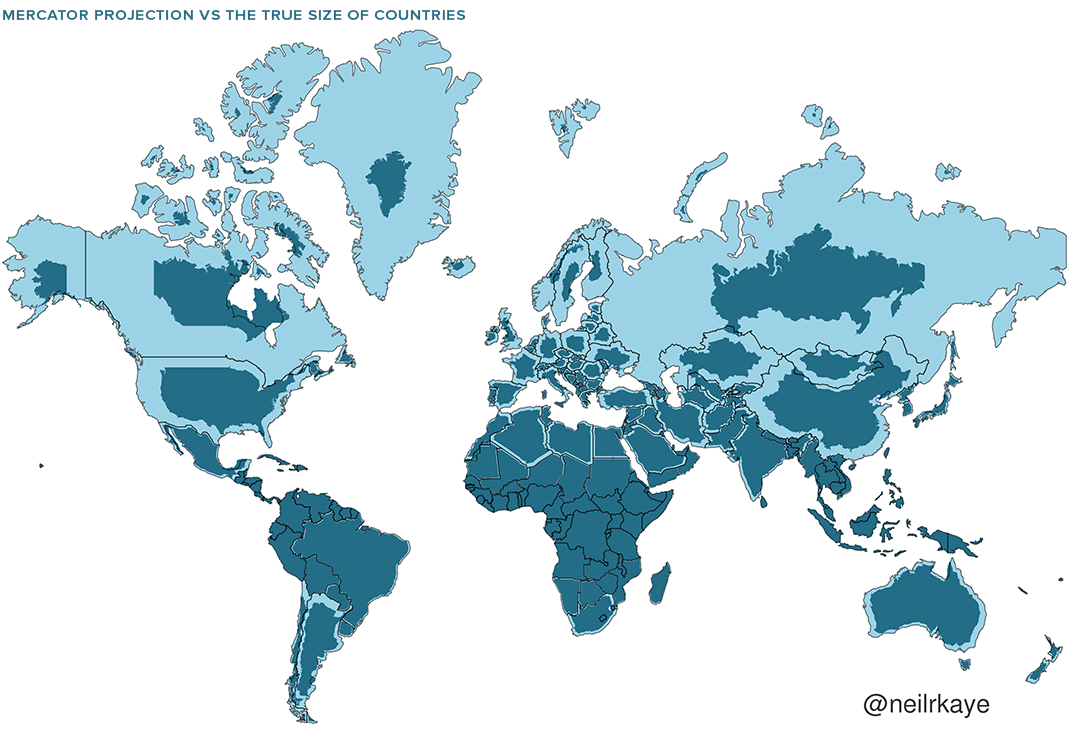
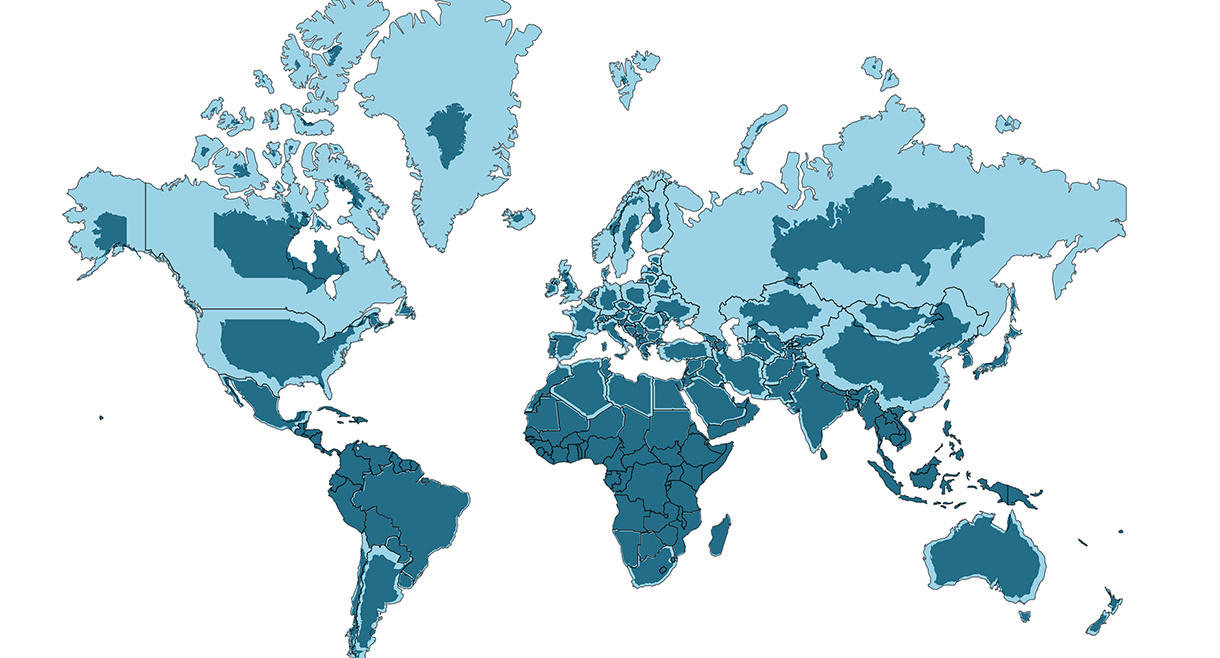
As the animated GIF below—created by Reddit user, neilrkaye – demonstrates, northern nations such as Canada and Russia have been artificially “pumped up” in the minds of many people around the world.
Greenland, which appears as a massive icy landmass in Mercator projection, shrinks way down. The continent of Africa takes a much more prominent position in this new, correctly-scaled map.
This visualization also highlights how distorted neighboring countries can look in Mercator projection. In the GIF above, Scandinavian countries no longer loom imposingly over their European neighbors, and Canada deflates to a size similar to the United States.
Despite inaccurate visual features—or perhaps because of them—the Mercator projection has achieved widespread adoption around the world. This includes in the classroom, where young minds are first learning about geography and forming opinions on the relationships between countries.
Getting Reacquainted with Globes
Google, whose map app is used by approximately 150 million people per month, took the bold step of using different projections for different purposes in 2018.
The Earth is depicted as a globe at further zoom levels, sidestepping map projection issues completely and displaying the world as it actually is: round. The result is a more accurate depiction of countries and landmasses.
With 3D Globe Mode on Google Maps desktop, Greenland's projection is no longer the size of Africa.
Just zoom all the way out at https://t.co/mIZTya01K3 😎🌍 pic.twitter.com/CIkkS7It8d
— Google Maps (@googlemaps) August 2, 2018
At closer zoom levels, users are typically using maps for things like navigation, which the Mercator projection was designed for. The exact angles of roads and borders are preserved in this projection.
In the Right Direction
In a more globally connected world, geographic literacy is more important than ever. As people become more accustomed to equal area maps and seeing the Earth in its spherical form, misconceptions about the size of continents may become a thing of the past.
This post was first published in 2018. We have since updated it, adding in new content for 2021.


Public Opinion
Charted: How Americans Feel About Federal Government Agencies
Fourteen of 16 federal government agencies garnered more favorable responses than unfavorable ones. But what were the outliers?
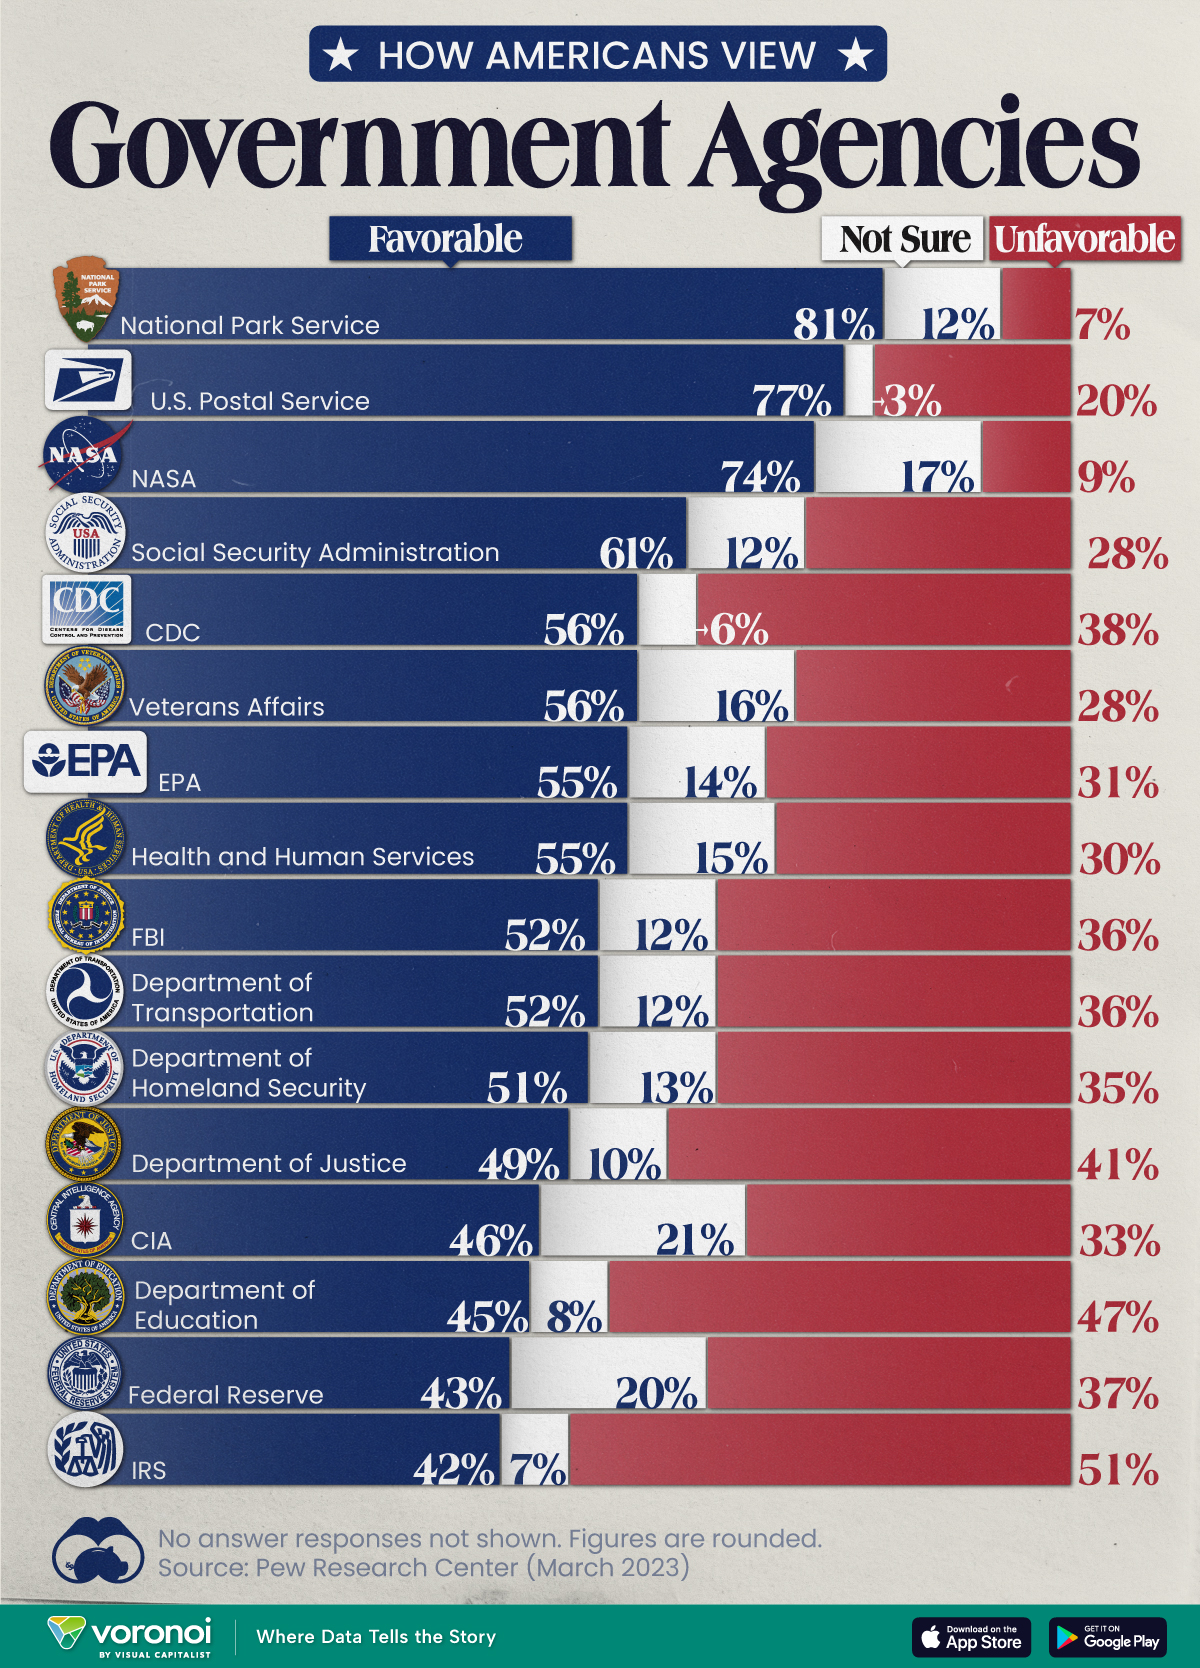

Chart: How Americans Rate 16 Federal Government Agencies
This was originally posted on our Voronoi app. Download the app for free on iOS or Android and discover incredible data-driven charts from a variety of trusted sources.
Come election time, America won’t hesitate to show its approval or disapproval of the country’s elected political representatives. That said, feelings about the federal bureaucracy and its associated agencies are a little harder to gauge.
We chart the results from an opinion poll conducted by Pew Research Center between March 13-19, 2023. In it, 10,701 adults—a representative of the U.S. adult population—were asked whether they felt favorably or unfavorably towards 16 different federal government agencies.
Americans Love the Park Service, Are Divided Over the IRS
Broadly speaking, 14 of the 16 federal government agencies garnered more favorable responses than unfavorable ones.
Of them, the Parks Service, Postal Service, and NASA all had the approval of more than 70% of the respondents.
| Agency | Favorable | Unfavorable | Not sure |
|---|---|---|---|
| 🏞️ National Park Service | 81% | 7% | 12% |
| 📮 U.S. Postal Service | 77% | 20% | 3% |
| 🚀 NASA | 74% | 9% | 17% |
| 💼 Social Security Administration | 61% | 28% | 12% |
| 🔬 CDC | 56% | 38% | 6% |
| 🎖️ Veterans Affairs | 56% | 28% | 16% |
| 🌿 EPA | 55% | 31% | 14% |
| 💉 Health & Human Services | 55% | 30% | 15% |
| 🕵️ FBI | 52% | 36% | 12% |
| 🚗 Department of Transportation | 52% | 36% | 12% |
| 🛡️ Department of Homeland Security | 51% | 35% | 13% |
| ⚖️ Department of Justice | 49% | 41% | 10% |
| 🕵️♂️ CIA | 46% | 33% | 21% |
| 📚 Department of Education | 45% | 47% | 8% |
| 💰 Federal Reserve | 43% | 37% | 20% |
| 💼 IRS | 42% | 51% | 7% |
Note: Figures are rounded. No answer responses are not shown.
Only the Department of Education and the IRS earned more unfavorable responses, and between them, only the IRS had a majority (51%) of unfavorable responses.
There are some caveats to remember with this data. Firstly, tax collection is a less-friendly activity than say, maintaining picturesque parks. Secondly, the survey was conducted a month before taxes were typically due, a peak time for experiencing filing woes.
Nevertheless, the IRS has come under fire in recent years. As per a New York Times article in 2019, eight years of budget cuts have stymied the agency’s ability to scrutinize tax filings from wealthier and more sophisticated filers.
At the same time poorer Americans are facing increasing audits on wage subsidies available to low income workers. According to a Transactional Records Access Clearinghouse report, this subset of filers was audited five-and-a-half more times the average American.

-

 Technology5 days ago
Mapped: The Number of AI Startups By Country
-

 Markets2 weeks ago
The Best U.S. Companies to Work for According to LinkedIn
-

 Economy2 weeks ago
Ranked: The Top 20 Countries in Debt to China
-

 Politics2 weeks ago
Charted: Trust in Government Institutions by G7 Countries
-

 Energy2 weeks ago
Mapped: The Age of Energy Projects in Interconnection Queues, by State
-

 Mining2 weeks ago
Visualizing Global Gold Production in 2023
-

 Markets1 week ago
Visualized: Interest Rate Forecasts for Advanced Economies
-

 Economy1 week ago
The Most Valuable Companies in Major EU Economies