Economy
Mapping The Biggest Companies By Market Cap in 60 Countries
View the full-size version of this infographic
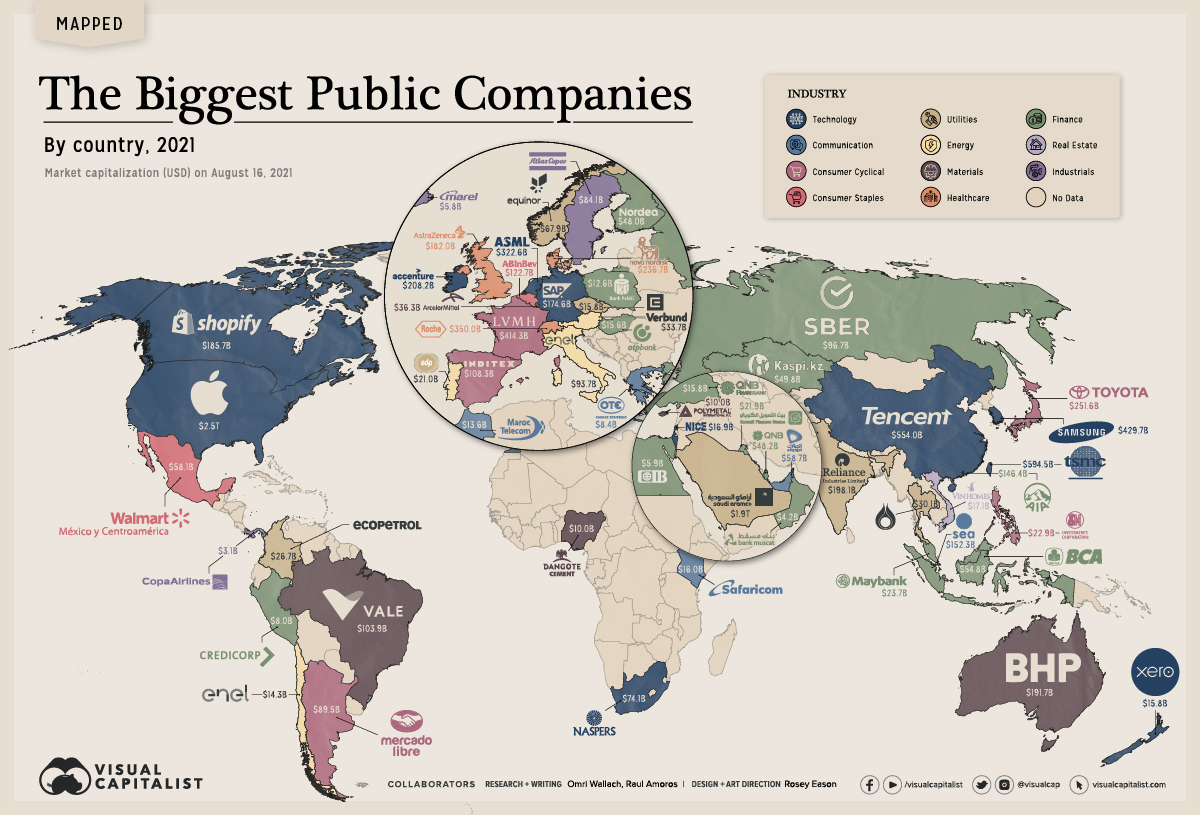


The Biggest Companies By Market Cap in 60 Countries
Tech giants are increasingly making up more of the Fortune 500, but the world’s biggest companies by market cap aren’t so cut and dry.
Despite accounting for the largest market caps worldwide—with trillion-dollar companies like Apple and contenders including Tencent and Samsung—tech wealth is largely concentrated in just a handful of countries.
So what are the biggest companies in each country? We mapped the largest company by market cap across 60 countries in August 2021 using market data from CompaniesMarketCap, TradingView, and MarketScreener.
What are the Largest Companies in the World?
The world has 60+ stock exchanges, and each one has a top company. We looked at the largest local company, since many of the world’s largest firms trade on multiple exchanges, and converted market cap to USD.
| Country | Company | Industry | Market Cap (August 2021) |
|---|---|---|---|
| USA | Apple | Technology | $2.5T |
| Saudi Arabia | Saudi Aramco | Energy | $1.9T |
| Taiwan | TSMC | Technology | $594.5B |
| China | Tencent | Technology | $554.0B |
| South Korea | Samsung | Technology | $429.7B |
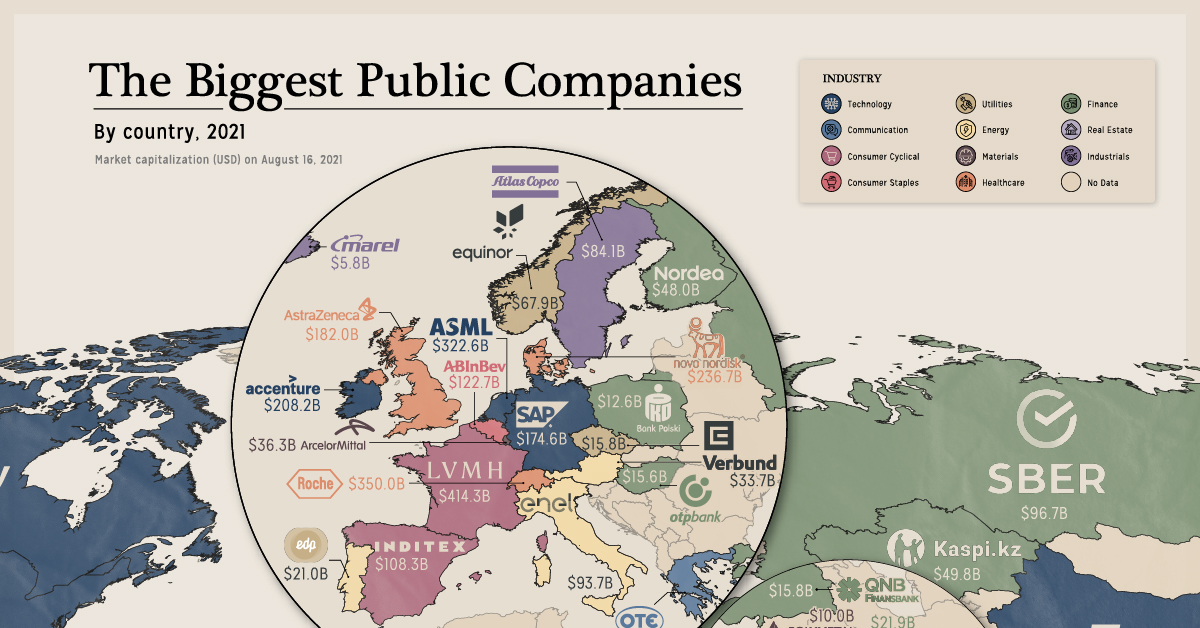
| France | LVMH | Consumer Cyclical | $414.3B |
| Switzerland | Roche | Healthcare | $350.0B |
| Netherlands | ASML | Technology | $322.6B |
| Japan | Toyota | Consumer Cyclical | $251.6B |
| Denmark | Novo Nordisk | Healthcare | $236.7B |
| Ireland | Accenture | Technology | $208.2B |
| India | Reliance Industries | Energy | $198.1B |
| Australia | BHP Group | Materials | $191.7B |
| Canada | Shopify | Technology | $185.7B |
| UK | Astrazeneca | Healthcare | $182.0B |
| Germany | SAP | Technology | $174.6B |
| Singapore | SEA | Technology | $152.3B |
| Hong Kong | AIA | Financials | $146.4B |
| Belgium | Anheuser-Busch Inbev | Consumer Staples | $122.7B |
| Spain | Inditex | Consumer Cyclical | $108.3B |
| Brazil | VALE | Materials | $103.9B |
| Russia | Sberbank | Financials | $96.7B |
| Italy | Enel | Utilities | $93.7B |
| Argentina | MercadoLibre | Consumer Cyclical | $89.5B |
| Sweden | Atlas Copco | Industrials | $84.1B |
| South Africa | Naspers | Technology | $74.1B |
| Norway | Equinor | Energy | $67.9B |
| UAE | Etisalat | Communication | $58.7B |
| Mexico | Walmex | Consumer Staples | $58.1B |
| Indonesia | Bank Cental Asia | Financials | $54.8B |
| Kazakhstan | Kaspi.kz | Financials | $49.8B |
| Qatar | QNB | Financials | $48.2B |
| Finland | Nordea Bank | Financials | $48.0B |
| Luxembourg | ArcelorMittal | Materials | $36.3B |
| Austria | Verbund | Utilities | $33.7B |
| Thailand | PTT PCL | Energy | $30.1B |
| Colombia | Ecopetrol | Energy | $26.7B |
| Malaysia | Maybank | Financials | $23.7B |
| Philippines | SM Investments | Consumer Cyclical | $22.9B |
| Kuwait | Kuwait Finance House | Financials | $21.9B |
| Portugal | EDP Group | Utilities | $21.0B |
| Vietnam | Vinhomes | Real Estate | $17.1B |
| Israel | NICE | Technology | $16.9B |
| Kenya | Safaricom | Communication | $16.0B |
| Czech Republic | ÄŒEZ Group | Energy | $15.8B |
| New Zealand | Xero | Technology | $15.8B |
| Turkey | QNB Finansbank | Financials | $15.8B |
| Hungary | OTP Bank | Financials | $15.6B |
| Chile | Enel Americas | Utilities | $14.3B |
| Morocco | Maroc Telecom | Communication | $13.6B |
| Poland | PKO Bank Polski | Financials | $12.6B |
| Cyprus | Polymetal | Materials | $10.0B |
| Nigeria | Dangote Group | Materials | $10.0B |
| Bahrain | Ahli United Bank | Financials | $8.6B |
| Greece | OTE Group | Communication | $8.4B |
| Peru | Credicorp | Financials | $8.0B |
| Egypt | Commercial International Bank | Financials | $5.9B |
| Iceland | Marel | Industrials | $5.8B |
| Oman | Bank Muscat | Financials | $4.2B |
| Panama | Copa Holdings | Industrials | $3.1B |
Many are former monopolies or massive conglomerates that have grown in the public space, such as South Africa’s Naspers and India’s Reliance Industries.
Others are local subsidiaries of foreign corporations, including Mexico’s Walmex, Chile’s Enel and Turkey’s QNB Finansbank.
But even more noticeable is the economic discrepancy. Apple and Saudi Aramco are worth trillions of dollars, while the smallest companies we tracked—including Panama’s Copa Group and Oman’s Bank Muscat—are worth less than $5 billion.
Finance and Tech Dominate The Biggest Companies By Market Cap
Across the board, the largest companies were able to accumulate wealth and value.
Some are newer to the top thanks to recent success. Canada’s Shopify has become one of the world’s largest e-commerce providers, and the UK’s AstraZeneca developed one of the world’s COVID-19 vaccines.
But the reality is most companies here are old guards that grew on existing resources, or in the case of banks, accumulated wealth.
| Industry | Biggest Companies by Country |
|---|---|
| Financials | 16 |
| Technology | 12 |
| Energy | 6 |
| Materials | 5 |
| Communication | 4 |
| Consumer Cyclical | 4 |
| Utilities | 4 |
| Healthcare | 3 |
| Industrials | 3 |
| Consumer Staples | 2 |
| Real Estate | 1 |
Banks were the most commonly found at the top of each country’s stock market. Closely behind were oil and gas giants, mining companies, and former state-owned corporations that drove most of a country’s wealth generation.
But as more economies develop and catch up to Western economies (where tech is dominant), newer innovative companies will likely put up a fight for each country’s top company crown.


Misc
Visualizing the Most Common Pets in the U.S.
Lions, tigers, and bears, oh my!—these animals do not feature on this list of popular American household pets.


Visualizing The Most Common Pets in the U.S.
This was originally posted on our Voronoi app. Download the app for free on iOS or Android and discover incredible data-driven charts from a variety of trusted sources.
In this graphic, we visualized the most common American household pets, based on 2023-2024 data from the American Pet Products Association (accessed via Forbes Advisor).
Figures represent the number of households that own each pet type, rather than the actual number of each animal. The “small animal” category includes hamsters, gerbils, rabbits, guinea pigs, chinchillas, mice, rats, and ferrets.
What is the Most Popular American Household Pet?
Based on this data, dogs—one of the first domesticated animals—are the most common pets in the United States. In fact, around 65 million households own a dog, and spend an average of $900 a year on their care.
| Rank | Species | Households |
|---|---|---|
| 1 | 🐶 Dog | 65M |
| 2 | 🐱 Cat | 47M |
| 3 | 🐟 Freshwater Fish | 11M |
| 4 | 🐰 Small Animals | 7M |
| 5 | 🐦 Bird | 6M |
| 6 | 🦎 Reptile | 6M |
| 7 | 🐴 Horse | 2M |
| 8 | 🐠 Saltwater Fish | 2M |
Note: Households can own multiple pets, and are counted for all relevant categories.
Cats rank second, at 47 million households, and these smaller felines are a little less expensive to own at $700/year according to Forbes estimates.
But aside from these two juggernauts, there are plenty of other common pet types found in households across the country.
Freshwater fish can be found in 11 million households, along with small animals—rabbits, hamsters, guinea pigs—in 7 million. Meanwhile, nearly 6 million homes have birds or reptiles.
Pet Ownership is on the Rise in America
Forbes found that 66% of all American households (numbering 87 million) own at least one pet, up from 56% in 1988. One third of these (29 million) own multiple pets.
A combination of factors is driving this increase: rising incomes, delayed childbirth, and of course the impact of the pandemic which nearly cleared out animal shelters across the globe.
America’s loneliness epidemic may also be a factor. Fledgling research has shown that single-individual households with pets recorded lower rates of loneliness during the pandemic than those without a pet.

-

 Brands6 days ago
How Tech Logos Have Evolved Over Time
-

 Economy2 weeks ago
Where U.S. Inflation Hit the Hardest in March 2024
-

 Green2 weeks ago
Top Countries By Forest Growth Since 2001
-

 United States2 weeks ago
Ranked: The Largest U.S. Corporations by Number of Employees
-

 Maps2 weeks ago
The Largest Earthquakes in the New York Area (1970-2024)
-

 Green2 weeks ago
Ranked: The Countries With the Most Air Pollution in 2023
-

 Green2 weeks ago
Ranking the Top 15 Countries by Carbon Tax Revenue
-

 Markets2 weeks ago
U.S. Debt Interest Payments Reach $1 Trillion