Money
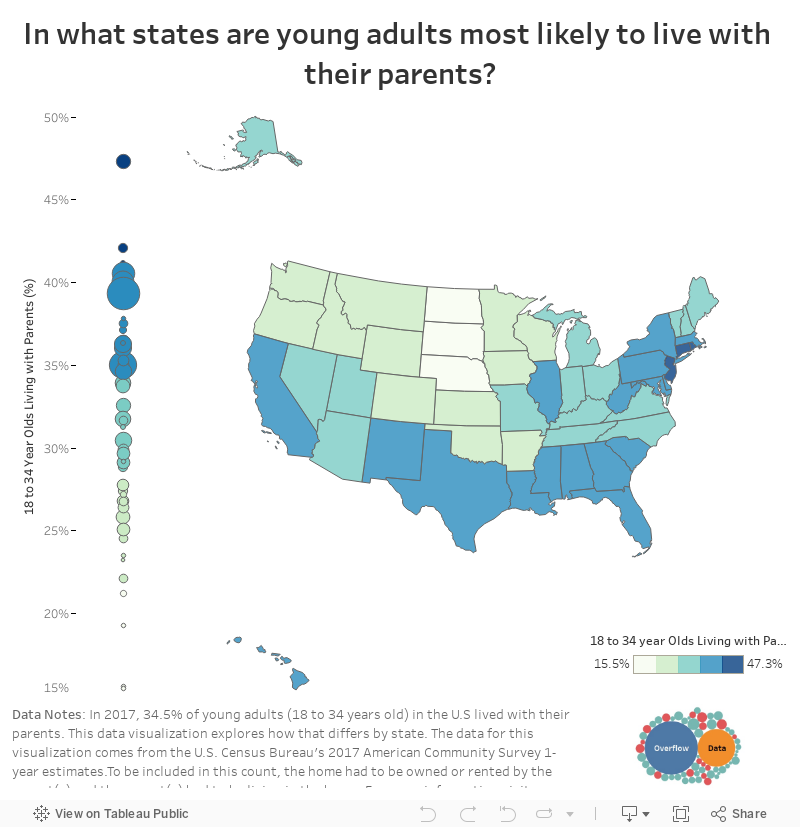
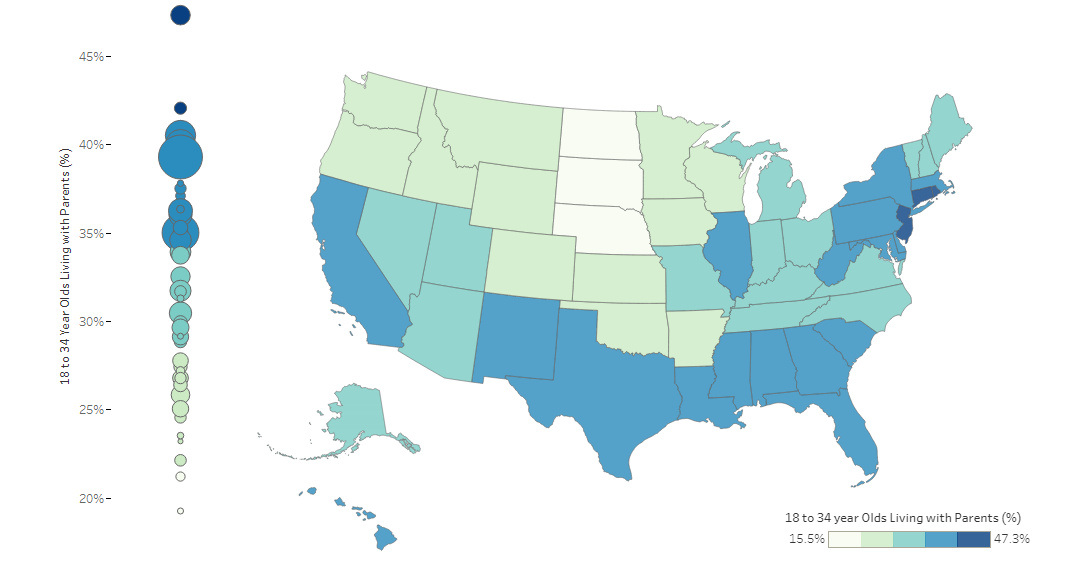
Map: Where Young Adults Live With Their Parents in the U.S.
var divElement = document.getElementById(‘viz1546499151607’); var vizElement = divElement.getElementsByTagName(‘object’)[0]; if ( divElement.offsetWidth > 800 ) { vizElement.style.width=’1000px’;vizElement.style.height=’827px’;} else if ( divElement.offsetWidth > 500 ) { vizElement.style.width=’100%’;vizElement.style.height=’827px’;} else { vizElement.style.width=’100%’;vizElement.style.height=’1027px’;} var scriptElement = document.createElement(‘script’); scriptElement.src = ‘https://public.tableau.com/javascripts/api/viz_v1.js’; vizElement.parentNode.insertBefore(scriptElement, vizElement);
Map: Where Young Adults Live With Their Parents in the U.S.
For a variety of different reasons, there is a growing proportion of young adults that are living with their parents in the United States.
As of 2017, it’s estimated that 34.5% of young adults (18-34 years old) in the U.S live at home – one of the highest percentages in recent memory. How does this national average compare to individual states, and how does data break down further by age and gender over time?
Living at Home
Today’s interactive map comes to us from Overflow Data, and visualizes data at the state level, showing a wide range from 16% (D.C., North Dakota) to closer to 47% (New Jersey).
Here are the five states with the highest proportion of young adults living at home:
| Rank | State | Population (Young Adults) | % Living at Home |
|---|---|---|---|
| #1 | New Jersey | 1.9 million | 47.3% |
| #2 | Connecticut | 0.7 million | 42.0% |
| #3 | New York | 4.5 million | 40.5% |
| #4 | Florida | 4.3 million | 40.0% |
| #5 | California | 9.4 million | 39.3% |
New Jersey is the surprising leader here, with 47.3% of young adults between 18-34 years living at home. This is at least partially a result of the state’s proximity to big cities like New York City and Philadelphia, in which young adults choose to commute instead of renting or buying places in those cities themselves.
With higher housing costs and rents, it’s also not surprising to see other states with large populations like California, Florida, and New York as being well represented at the top of the list.
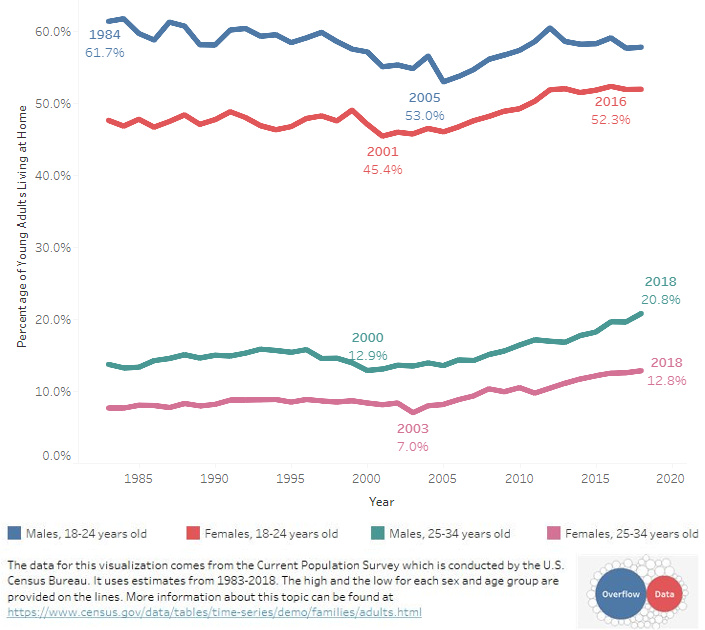
Differences by Age
While figures are going up across the board, a particular subsegment (25-34 years old) stands out as rising to its highest point in at least 30 years.
Both men and women in this older millennial segment are starting to become more likely to stay at home:
There are many potential culprits for this trend, including social and economic factors.
It’s well-documented that millennials are marrying later, which is a traditional impetus for moving away from home. Today’s young adults are also putting off having kids until later in adulthood.
At the same time, on the economic front, higher housing prices and mounting student debt are two factors that are preventing young adults from having the necessary resources to move out as early as they might like.
What do you think is the major cause behind this trend, and do you think it will reverse?


Economy
Ranked: The Top 20 Countries in Debt to China
The 20 nations featured in this graphic each owe billions in debt to China, posing concerns for their economic future.
Ranked: The Top 20 Countries in Debt to China
This was originally posted on our Voronoi app. Download the app for free on iOS or Android and discover incredible data-driven charts from a variety of trusted sources.
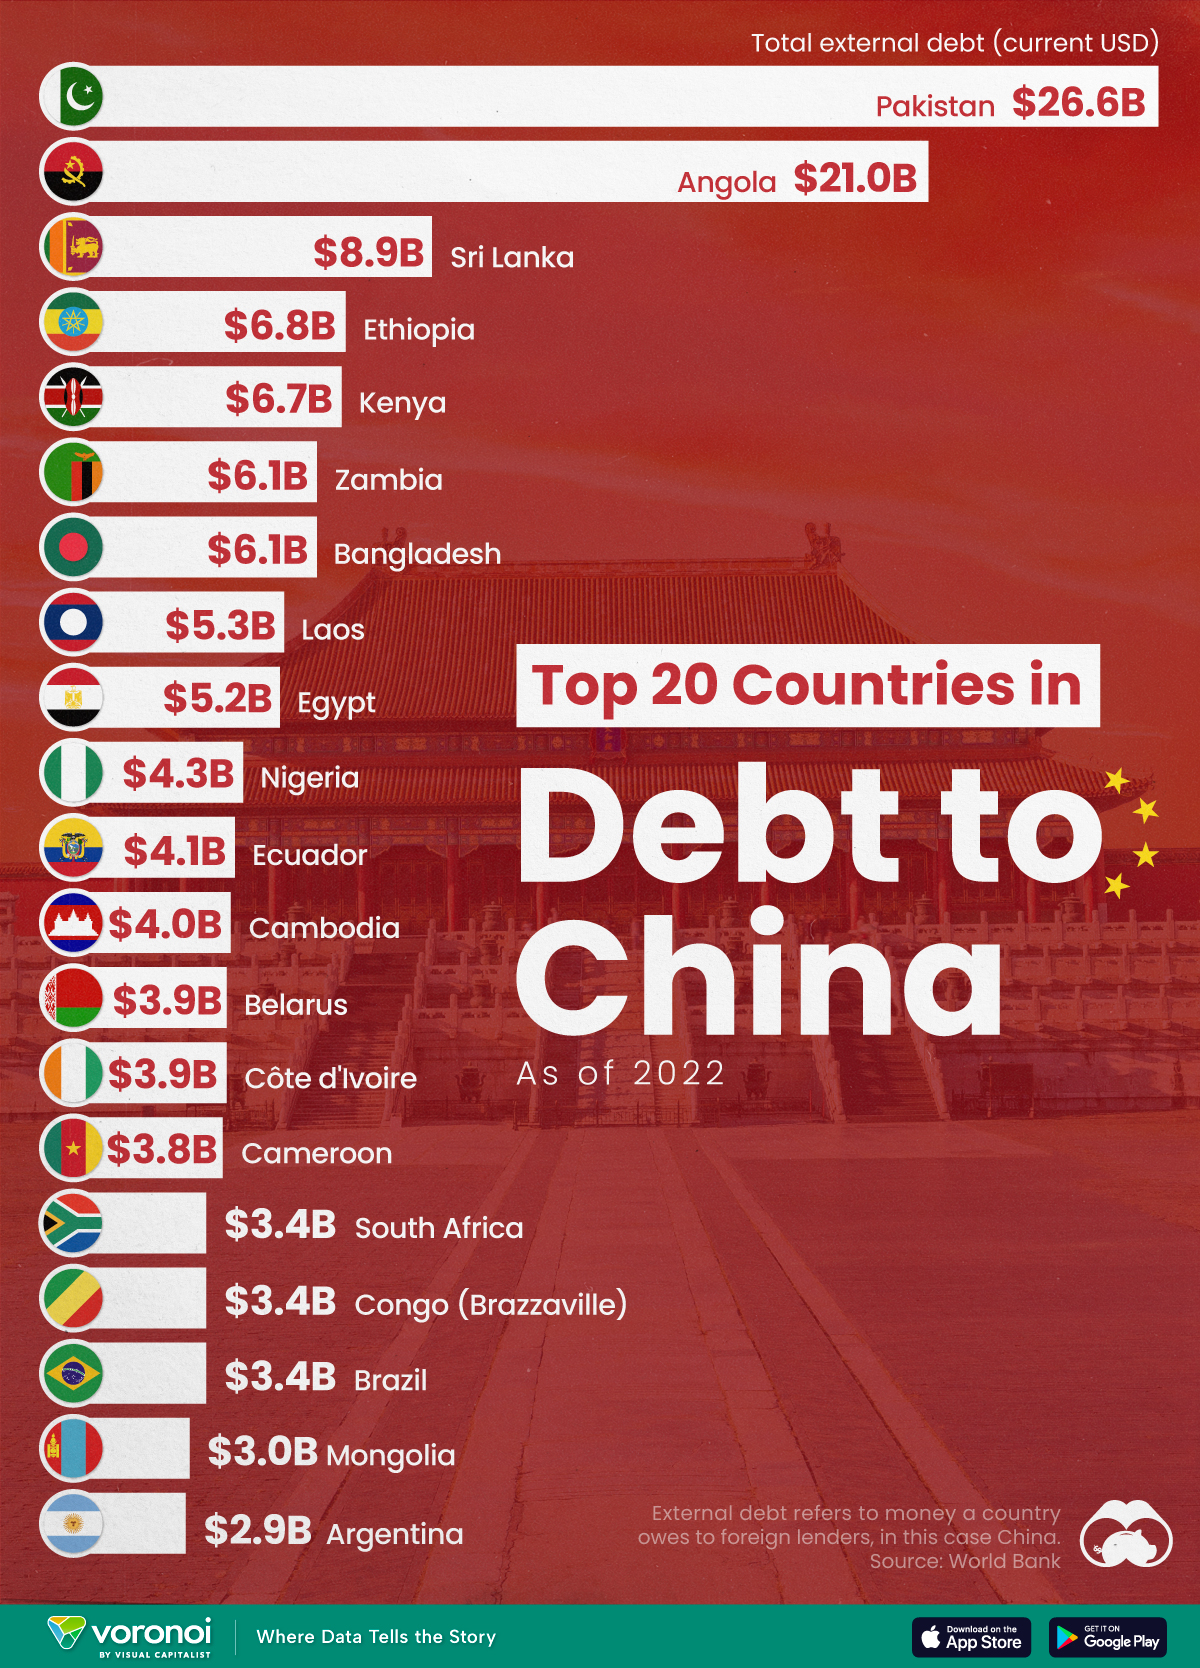
In this graphic, we ranked the top 20 countries by their amount of debt to China. These figures are as of 2022, and come from the World Bank (accessed via Yahoo Finance).
The data used to make this graphic can be found in the table below.
| Country | Total external debt to China ($B) |
|---|---|
| 🇵🇰 Pakistan | $26.6 |
| 🇦🇴 Angola | $21.0 |
| 🇱🇰 Sri Lanka | $8.9 |
| 🇪🇹 Ethiopia | $6.8 |
| 🇰🇪 Kenya | $6.7 |
| 🇧🇩 Bangladesh | $6.1 |
| 🇿🇲 Zambia | $6.1 |
| 🇱🇦 Laos | $5.3 |
| 🇪🇬 Egypt | $5.2 |
| 🇳🇬 Nigeria | $4.3 |
| 🇪🇨 Ecuador | $4.1 |
| 🇰🇭 Cambodia | $4.0 |
| 🇨🇮 Côte d'Ivoire | $3.9 |
| 🇧🇾 Belarus | $3.9 |
| 🇨🇲 Cameroon | $3.8 |
| 🇧🇷 Brazil | $3.4 |
| 🇨🇬 Republic of the Congo | $3.4 |
| 🇿🇦 South Africa | $3.4 |
| 🇲🇳 Mongolia | $3.0 |
| 🇦🇷 Argentina | $2.9 |
This dataset highlights Pakistan and Angola as having the largest debts to China by a wide margin. Both countries have taken billions in loans from China for various infrastructure and energy projects.
Critically, both countries have also struggled to manage their debt burdens. In February 2024, China extended the maturity of a $2 billion loan to Pakistan.
Soon after in March 2024, Angola negotiated a lower monthly debt payment with its biggest Chinese creditor, China Development Bank (CDB).
Could China be in Trouble?
China has provided developing countries with over $1 trillion in committed funding through its Belt and Road Initiative (BRI), a massive economic development project aimed at enhancing trade between China and countries across Asia, Africa, and Europe.
Many believe that this lending spree could be an issue in the near future.
According to a 2023 report by AidData, 80% of these loans involve countries in financial distress, raising concerns about whether participating nations will ever be able to repay their debts.
While China claims the BRI is a driver of global development, critics in the West have long warned that the BRI employs debt-trap diplomacy, a tactic where one country uses loans to gain influence over another.
Editor’s note: The debt shown in this visualization focuses only on direct external debt, and does not include publicly-traded, liquid, debt securities like bonds. Furthermore, it’s worth noting the World Bank data excludes some countries with data accuracy or reporting issues, such as Venezuela.
Learn More About Debt from Visual Capitalist
If you enjoyed this post, check out our breakdown of $97 trillion in global government debt.

-

 Culture7 days ago
The World’s Top Media Franchises by All-Time Revenue
-

 Science2 weeks ago
Visualizing the Average Lifespans of Mammals
-

 Brands2 weeks ago
How Tech Logos Have Evolved Over Time
-

 Energy2 weeks ago
Ranked: The Top 10 EV Battery Manufacturers in 2023
-

 Countries2 weeks ago
Countries With the Largest Happiness Gains Since 2010
-

 Economy2 weeks ago
VC+: Get Our Key Takeaways From the IMF’s World Economic Outlook
-

 Demographics2 weeks ago
The Countries That Have Become Sadder Since 2010
-

 Money2 weeks ago
Charted: Who Has Savings in This Economy?