Misc
The Numbers Behind America’s Opioid Epidemic
The Numbers Behind America’s Opioid Epidemic
Drug overdoses are the leading cause of death for Americans under the age of 50, who are now more likely to die from a drug overdose than from car accidents or firearms. The United States has the dubious distinction of having the highest percentage of drug-related deaths in the world.
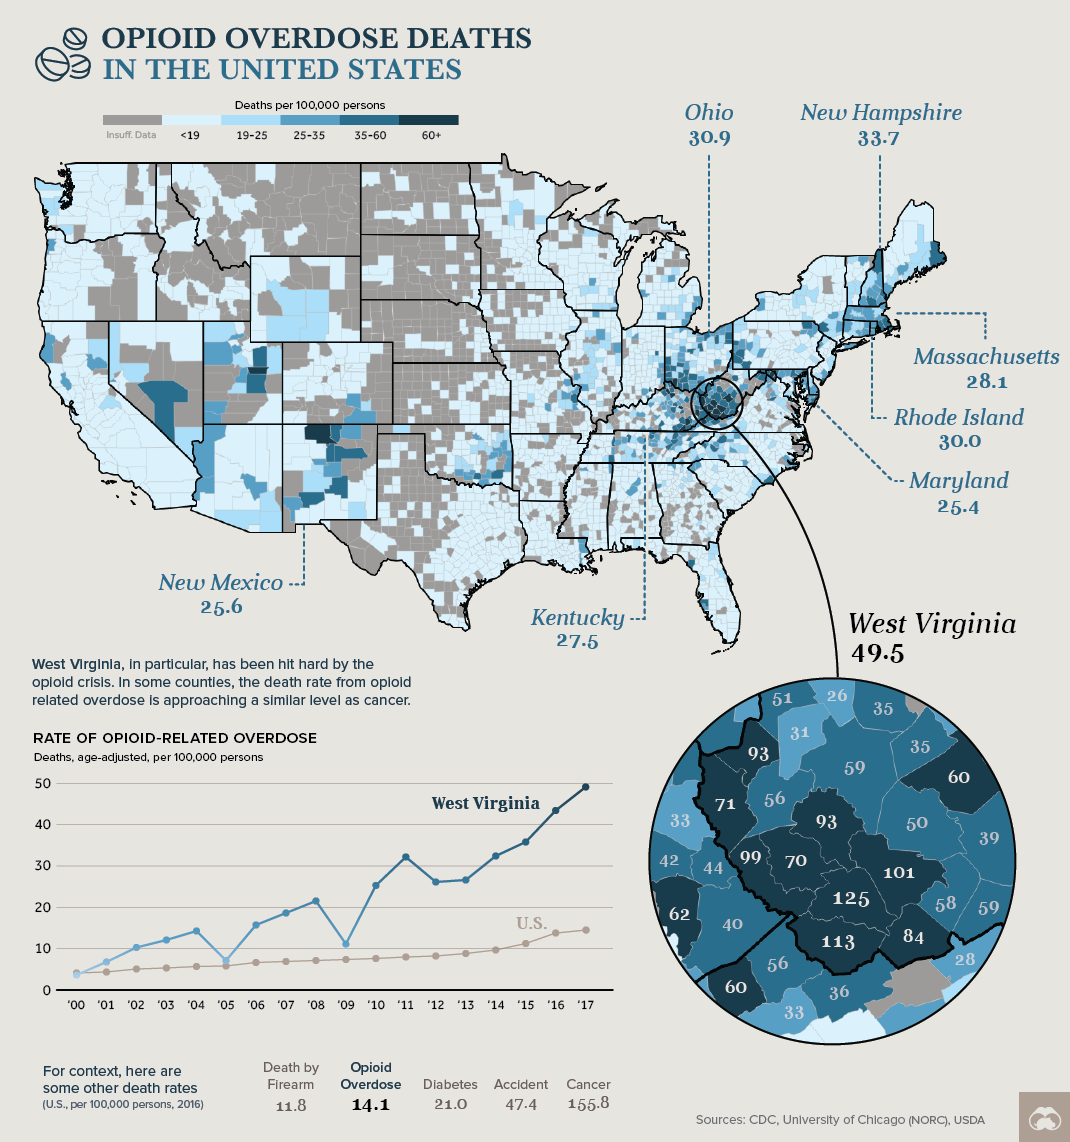
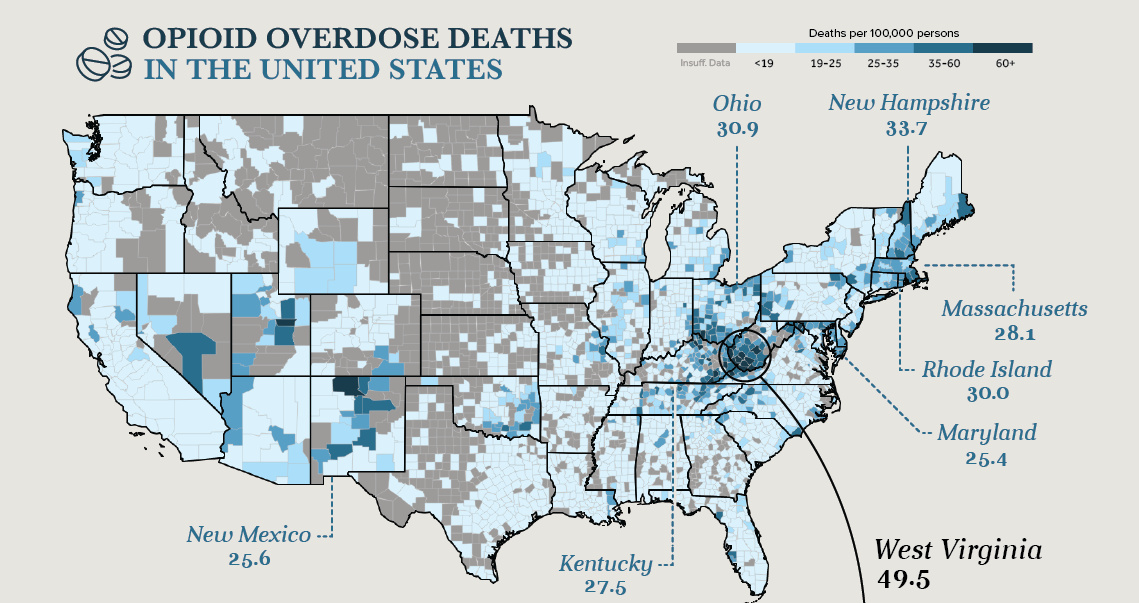
While opioid abuse is a nationwide problem, there are specific areas that are being hit harder by this epidemic. Using the location data above, from NORC at the University of Chicago, we can see clusters of counties that have an extremely high rate of overdose deaths. Between 2012 and 2016, West Virginia, Kentucky, and Ohio saw a combined 18,000 deaths related to opioid abuse.
A sharp increase in prescribed opioid-based painkillers and the rise of illegal fentanyl – which is up to 50 times stronger than heroin – has unleashed the worst public health crisis in American history.
It’s a problem that can be tough to understand, but by delving into the data, some key observations emerge.
Doctors Prescribed a lot of Pain Killers
Beginning in the 1980s, prescription opioids like oxycodone and hydrocodone were heavily marketed as a treatment for pain, and at the time, the risk of addiction to these substances was downplayed. Opioid prescriptions nearly tripled between 1991 and 2011.
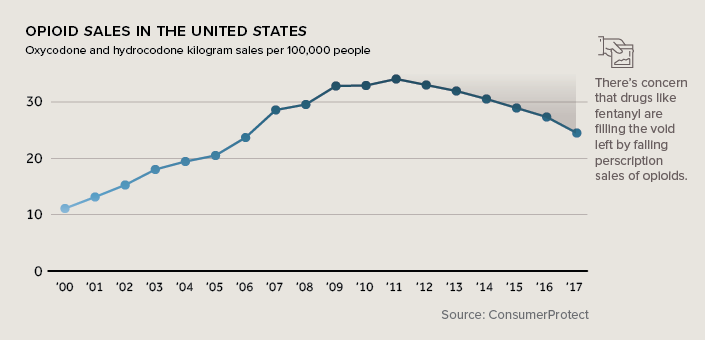
Sales of these powerful painkillers are beginning to drop, in part because the risk of addiction has now been widely publicized. Another decelerating factor is the crackdown on clinics and pharmacies that were over-dispensing painkillers, in some cases directly feeding the elicit drug market.
In 2015, nearly 100 million Americans were prescribed painkillers by their doctor. A recent survey showed one-third of people who abused prescription painkillers in the past year got pills directly from a physician.
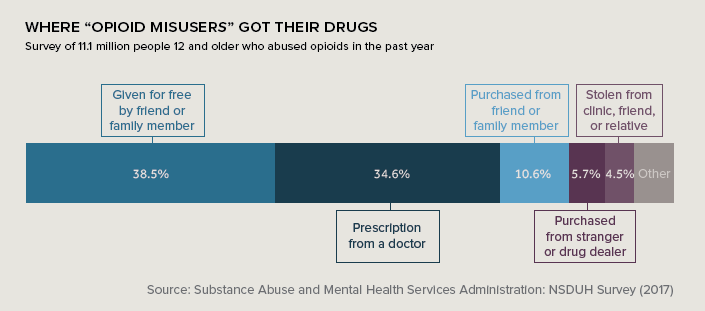
This abundance of pills impacts the community at large when excess pills are sold, stolen, or simply given to others. In fact, receiving painkillers from a friend or family member was the most common gateway to abusing opioids.
Fentanyl is Killing a lot of People
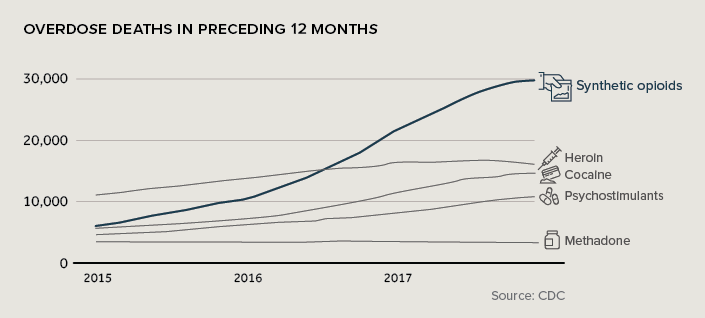
If doctors have been prescribing opioids for decades, what is causing this recent spike in overdoses? The answer, for the most part, is fentanyl.
This synthetic opioid presents a problem because it’s extremely potent – it only takes about 2 milligrams to overdose on the drug. Since much of the fentanyl on the market is sourced illegally, doses can and do exceed this amount on a regular basis.
As a result, overdose deaths related to opioids have skyrocketed in recent years:
Overdoses are the tip of the Iceberg
The thousands of overdose deaths around the country are the most extreme symptom of the opioid epidemic, but the problem runs much deeper.
In 2017, there were over 11 million “opioid misusers” in the United States. To put that number in perspective, that’s equivalent to the entire population of Ohio. In fact, the problem is so widespread, that it’s suspected to be influencing workforce participation rates.
The health care burden of the crisis is also staggering. The cost of opioid abuse ranges from $10,000 to $20,000 in annual medical costs per patient.
The hard truth is that, unless bold action is taken, the opioid epidemic is projected to claim nearly 500,000 lives over the next decade.


Misc
Visualizing the Most Common Pets in the U.S.
Lions, tigers, and bears, oh my!—these animals do not feature on this list of popular American household pets.


Visualizing The Most Common Pets in the U.S.
This was originally posted on our Voronoi app. Download the app for free on iOS or Android and discover incredible data-driven charts from a variety of trusted sources.
In this graphic, we visualized the most common American household pets, based on 2023-2024 data from the American Pet Products Association (accessed via Forbes Advisor).
Figures represent the number of households that own each pet type, rather than the actual number of each animal. The “small animal” category includes hamsters, gerbils, rabbits, guinea pigs, chinchillas, mice, rats, and ferrets.
What is the Most Popular American Household Pet?
Based on this data, dogs—one of the first domesticated animals—are the most common pets in the United States. In fact, around 65 million households own a dog, and spend an average of $900 a year on their care.
| Rank | Species | Households |
|---|---|---|
| 1 | 🐶 Dog | 65M |
| 2 | 🐱 Cat | 47M |
| 3 | 🐟 Freshwater Fish | 11M |
| 4 | 🐰 Small Animals | 7M |
| 5 | 🐦 Bird | 6M |
| 6 | 🦎 Reptile | 6M |
| 7 | 🐴 Horse | 2M |
| 8 | 🐠 Saltwater Fish | 2M |
Note: Households can own multiple pets, and are counted for all relevant categories.
Cats rank second, at 47 million households, and these smaller felines are a little less expensive to own at $700/year according to Forbes estimates.
But aside from these two juggernauts, there are plenty of other common pet types found in households across the country.
Freshwater fish can be found in 11 million households, along with small animals—rabbits, hamsters, guinea pigs—in 7 million. Meanwhile, nearly 6 million homes have birds or reptiles.
Pet Ownership is on the Rise in America
Forbes found that 66% of all American households (numbering 87 million) own at least one pet, up from 56% in 1988. One third of these (29 million) own multiple pets.
A combination of factors is driving this increase: rising incomes, delayed childbirth, and of course the impact of the pandemic which nearly cleared out animal shelters across the globe.
America’s loneliness epidemic may also be a factor. Fledgling research has shown that single-individual households with pets recorded lower rates of loneliness during the pandemic than those without a pet.

-

 Science7 days ago
Visualizing the Average Lifespans of Mammals
-

 Markets2 weeks ago
The Top 10 States by Real GDP Growth in 2023
-

 Demographics2 weeks ago
The Smallest Gender Wage Gaps in OECD Countries
-

 United States2 weeks ago
Where U.S. Inflation Hit the Hardest in March 2024
-

 Green2 weeks ago
Top Countries By Forest Growth Since 2001
-

 United States2 weeks ago
Ranked: The Largest U.S. Corporations by Number of Employees
-

 Maps2 weeks ago
The Largest Earthquakes in the New York Area (1970-2024)
-

 Green2 weeks ago
Ranked: The Countries With the Most Air Pollution in 2023