Markets
Are American Consumers Taking On Too Much Debt?
How much consumer debt is too much?
Today’s infographic uses extensive data from Equifax to try and answer this question.
We put consumer debt in a historical context, while providing an in-depth look at the latest numbers on different categories of debt such as student loans, credit cards, and mortgages to see how they compare.

In the United States, there are three broad types of debt in the spectrum: government, corporate, and consumer debt.
Government debt consists of federal, state, and municipal debt, and adds to a total of 136% of GDP. Meanwhile, corporate and consumer debt, which together constitute private debt, amount to 197% of GDP.
The History of Consumer Debt
Before diving into the numbers, there are two historical developments worth mentioning that have greatly influenced consumer debt.
The first is the rise of consumer credit through the 20th century.
If you go back to the 1800s, it was a different place:
- Information moved as fast as a boat.
- 90% of Americans lived in rural areas.
- 75% of Americans were involved with agricultural production.
- There was a stigma around borrowing to buy luxury items, and some saw it as immoral.
- Credit was only used in essential cases, such as borrowing money to buy seeds for farming.
- Credit history was oral and based on personal reputation.
Today is vastly different. Information travels instantaneously, the economy is diversified, computers are everywhere, and factories pump out cheap goods that people want to buy. Credit history is universal, and 72% of Americans have at least one credit card.
For more information about the development of credit in the 20th century, check out this motion graphic video on the history of credit cards.
The second factor that greatly influenced today’s consumer debt situation was government intervention in the mortgage markets between 1949 and 2000.
Agencies such as the Federal Housing Administration (FHA), Ginnie Mae, Fannie Mae, and Freddie Mac were active with the following objectives:
- Insuring mortgages
- Providing liquidity to the mortgage finance system
- Stabilizing the mortgage market
- Expanding the secondary market for mortgages
Between 1949 and 2000, home ownership increased from 54% to 64.7%.
However, that coincided with increases in debt-to-income ratios (20% to 73%) and mortgage debt to household assets (15% to 41%).
The Composition of Consumer Debt
According to Equifax, U.S. consumer debt is at $12.44 trillion. Here’s how it breaks down:
| Type | Debt | Percentage |
|---|---|---|
| Mortgage | $8.96 trillion | 72.0% |
| Student Loans | $1.27 trillion | 10.2% |
| Auto Loans | $1.14 trillion | 9.2% |
| Credit Card | $0.74 trillion | 6.0% |
| Other | $0.33 trillion | 2.6% |
| Total Consumer Debt | $12.44 trillion | 100.0% |
Consumer Debt Trends
1. Mortgage Debt
Mortgage debt, by far the largest category of consumer debt, peaked during the 2008 Financial Crisis at close to $10 trillion. Today, however, it makes up 72% of total consumer debt at $8.96 trillion.
This debt has been partially fueled by the lowest interest rates in history, which have put mortgage rates at all-time lows.
Since 2010, mortgage defaults and delinquencies have both trended down back towards normal levels.
2. Student Loans
For the first time in history, consumers are more in debt to student loans than any other type of non-mortgage debt.
The amount of student debt per person has steadily increased each year – especially for young people. For 18-25 year olds, student loan debt per person has increased from $4,637 in 2005 to $10,552 in 2015. The average young millennial now owes over 60% of of their non-mortgage debt to student loans.
In total, Americans now have $1.3 trillion in student debt, spread between 44 million people.
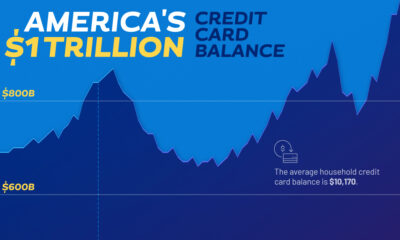
3. Credit Cards and Private Label Cards
Credit card spending has been steadily increasing since the Financial Crisis, but it has not yet hit pre-crisis levels yet. As it stands, Americans have $665.8 billion in credit card debt spread between 391.9 million cards.
Debt from private label cards, on the other hand, has surpassed pre-crisis levels. Private label cards are typically used to provide credit at department stores, furniture stores, and other retail locations. It is now at $77.4 billion, though this is relatively small compared to other credit card debt that exists.
4. Auto Loans
Total outstanding balances on auto loans and leases have increased 9.3% year-over-year to $1.14 trillion – putting it at all-time highs and making it the third largest consumer debt market overall.
However, auto loan delinquencies have been generally trending down over recent years.
Putting it All Together
As far as non-mortgage debt goes, consumers have never been more indebted.
However, mortgage debt is what really moves the needle for total debt numbers – and that is still not near levels seen during the Financial Crisis.
| Type | Amount | All-time Highs? |
|---|---|---|
| Mortgage | $8.96 trillion | No |
| Student Loans | $1.27 trillion | Yes |
| Auto Loans | $1.14 trillion | Yes |
| Credit Card | $0.67 trillion | No |
| Private Label Cards | $0.08 trillion | Yes |
| Other | $0.33 trillion | n/a |


Markets
Mapped: Europe’s GDP Per Capita, by Country
Which European economies are richest on a GDP per capita basis? This map shows the results for 44 countries across the continent.


Mapped: Europe’s GDP Per Capita, by Country (2024)
This was originally posted on our Voronoi app. Download the app for free on iOS or Android and discover incredible data-driven charts from a variety of trusted sources.
Europe is home to some of the largest and most sophisticated economies in the world. But how do countries in the region compare with each other on a per capita productivity basis?
In this map, we show Europe’s GDP per capita levels across 44 nations in current U.S. dollars. Data for this visualization and article is sourced from the International Monetary Fund (IMF) via their DataMapper tool, updated April 2024.
Europe’s Richest and Poorest Nations, By GDP Per Capita
Luxembourg, Ireland, and Switzerland, lead the list of Europe’s richest nations by GDP per capita, all above $100,000.
| Rank | Country | GDP Per Capita (2024) |
|---|---|---|
| 1 | 🇱🇺 Luxembourg | $131,380 |
| 2 | 🇮🇪 Ireland | $106,060 |
| 3 | 🇨🇭 Switzerland | $105,670 |
| 4 | 🇳🇴 Norway | $94,660 |
| 5 | 🇮🇸 Iceland | $84,590 |
| 6 | 🇩🇰 Denmark | $68,900 |
| 7 | 🇳🇱 Netherlands | $63,750 |
| 8 | 🇸🇲 San Marino | $59,410 |
| 9 | 🇦🇹 Austria | $59,230 |
| 10 | 🇸🇪 Sweden | $58,530 |
| 11 | 🇧🇪 Belgium | $55,540 |
| 12 | 🇫🇮 Finland | $55,130 |
| 13 | 🇩🇪 Germany | $54,290 |
| 14 | 🇬🇧 UK | $51,070 |
| 15 | 🇫🇷 France | $47,360 |
| 16 | 🇦🇩 Andorra | $44,900 |
| 17 | 🇲🇹 Malta | $41,740 |
| 18 | 🇮🇹 Italy | $39,580 |
| 19 | 🇨🇾 Cyprus | $37,150 |
| 20 | 🇪🇸 Spain | $34,050 |
| 21 | 🇸🇮 Slovenia | $34,030 |
| 22 | 🇪🇪 Estonia | $31,850 |
| 23 | 🇨🇿 Czech Republic | $29,800 |
| 24 | 🇵🇹 Portugal | $28,970 |
| 25 | 🇱🇹 Lithuania | $28,410 |
| 26 | 🇸🇰 Slovakia | $25,930 |
| 27 | 🇱🇻 Latvia | $24,190 |
| 28 | 🇬🇷 Greece | $23,970 |
| 29 | 🇭🇺 Hungary | $23,320 |
| 30 | 🇵🇱 Poland | $23,010 |
| 31 | 🇭🇷 Croatia | $22,970 |
| 32 | 🇷🇴 Romania | $19,530 |
| 33 | 🇧🇬 Bulgaria | $16,940 |
| 34 | 🇷🇺 Russia | $14,390 |
| 35 | 🇹🇷 Türkiye | $12,760 |
| 36 | 🇲🇪 Montenegro | $12,650 |
| 37 | 🇷🇸 Serbia | $12,380 |
| 38 | 🇦🇱 Albania | $8,920 |
| 39 | 🇧🇦 Bosnia & Herzegovina | $8,420 |
| 40 | 🇲🇰 North Macedonia | $7,690 |
| 41 | 🇧🇾 Belarus | $7,560 |
| 42 | 🇲🇩 Moldova | $7,490 |
| 43 | 🇽🇰 Kosovo | $6,390 |
| 44 | 🇺🇦 Ukraine | $5,660 |
| N/A | 🇪🇺 EU Average | $44,200 |
Note: Figures are rounded.
Three Nordic countries (Norway, Iceland, Denmark) also place highly, between $70,000-90,000. Other Nordic peers, Sweden and Finland rank just outside the top 10, between $55,000-60,000.
Meanwhile, Europe’s biggest economies in absolute terms, Germany, UK, and France, rank closer to the middle of the top 20, with GDP per capitas around $50,000.
Finally, at the end of the scale, Eastern Europe as a whole tends to have much lower per capita GDPs. In that group, Ukraine ranks last, at $5,660.
A Closer Look at Ukraine
For a broader comparison, Ukraine’s per capita GDP is similar to Iran ($5,310), El Salvador ($5,540), and Guatemala ($5,680).
According to experts, Ukraine’s economy has historically underperformed to expectations. After the fall of the Berlin Wall, the economy contracted for five straight years. Its transition to a Western, liberalized economic structure was overshadowed by widespread corruption, a limited taxpool, and few revenue sources.
Politically, its transformation from authoritarian regime to civil democracy has proved difficult, especially when it comes to institution building.
Finally, after the 2022 invasion of the country, Ukraine’s GDP contracted by 30% in a single year—the largest loss since independence. Large scale emigration—to the tune of six million refugees—is also playing a role.
Despite these challenges, the country’s economic growth has somewhat stabilized while fighting continues.

-

 Markets6 days ago
The Most Valuable Companies in Major EU Economies
-

 Wealth2 weeks ago
Charted: Which City Has the Most Billionaires in 2024?
-

 Technology2 weeks ago
All of the Grants Given by the U.S. CHIPS Act
-

 Green2 weeks ago
The Carbon Footprint of Major Travel Methods
-

 United States1 week ago
Visualizing the Most Common Pets in the U.S.
-

 Culture1 week ago
The World’s Top Media Franchises by All-Time Revenue
-

 voronoi1 week ago
Best Visualizations of April on the Voronoi App
-

 Wealth1 week ago
Charted: Which Country Has the Most Billionaires in 2024?