Energy
The Changing Anatomy of U.S. Oil Imports Over the Last Decade
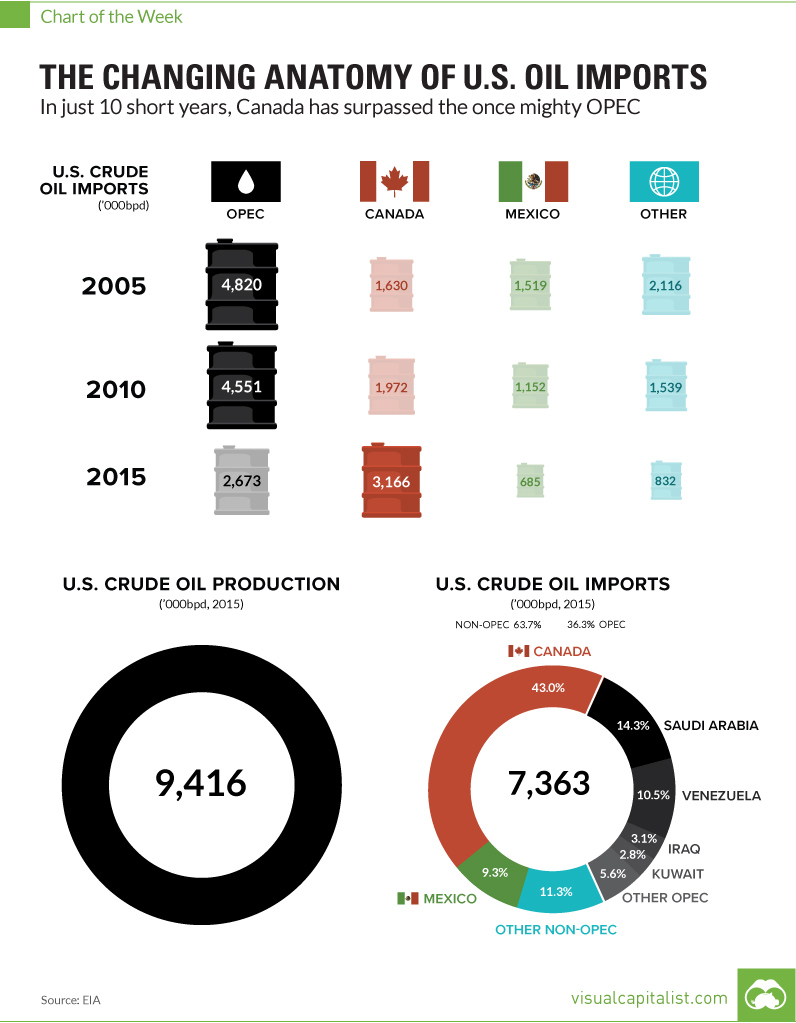
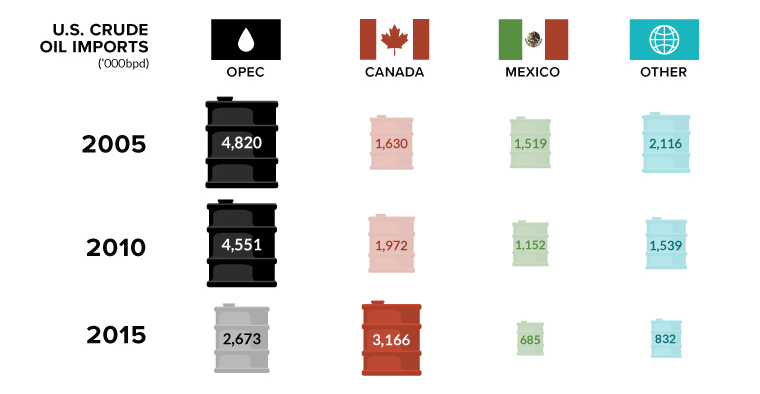
The Changing Anatomy of U.S. Oil Imports
In 10 short years, Canada has replaced the once mighty OPEC
The Chart of the Week is a weekly Visual Capitalist feature on Fridays.
OPEC was once a name that made world leaders shake in their boots.
In the early 1970s, the infamous oil cartel controlled more than 50% of global market share. The power of the cartel was also clear – in response to the Yom Kippur War of 1973, many OPEC countries (that were a part of OAPEC – the Organization for Arab Petroleum Exporting Countries) initiated production cuts and an oil embargo against Western countries.
Oil prices quadrupled from $3 to $12, and OPEC producers raked in the cash.
Meanwhile, the West was in a panic. Emergency energy rations were imposed, currencies were devalued, gasoline sales were restricted, and Sunday driving was banned in seven European countries.
No Longer Mighty?
The organization still has some influence, though it seems to be harder to come by.
After many months of squabbling, OPEC recently came to its first deal to cut production since 2008. That’s kept the oil price above $50/bbl, but gains will be effectively capped once low-cost shale producers ramp up production again.
OPEC often touts its 81% share of global “proven” reserves as a sign of its might:
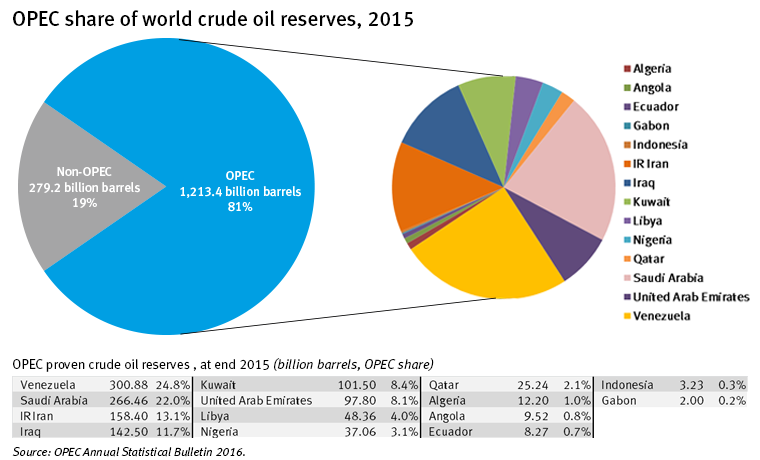
However, it seems OPEC’s peak influence is in the rear-view mirror due to several external factors.
To start with the obvious, oil is slowly waning in importance in the global energy mix. According to the EIA, oil made up 34% of total global energy demand in 2010. By the year 2040, the EIA expects this share will be closer to 30%, though things could happen faster if the technology behind renewables and batteries makes a bigger impact than expected.
Next, U.S. domestic production has almost doubled because of the shale and fracking revolution. In 2008, the U.S. produced 5.0 million bpd, and in 2015 the country averaged 9.4 million bpd.
Lastly, as you can see on the chart, accelerated development of Canada’s Oil Sands has enabled the U.S. to buy any imports needed from Canada instead of the Middle East. In 2005, Canada only supplied 16.1% of U.S. oil imports, but Canada is now the major supplier of oil to the U.S. with a massive 43.0% share.
With Donald Trump taking the reins in 2017, Obama’s decision on the Keystone XL pipeline could easily be reversed and then fast-tracked for completion. Such a move could bump Canada’s share of U.S. oil imports even higher, downsizing influence from OPEC even more.
Internal Friction
It’s not just a changing global macro environment that is hurting OPEC’s influence.
Internally, their members have shifting goals and needs, and this has made the organization largely dysfunctional over recent years.
The biggest factor? It’s Saudi Arabia, a country that is the largest oil producer in the group, but also a global low-cost leader. It has outsized influence in the cartel, but it also has way bigger margins to play with. This means that sometimes maintaining market share is more important than maximizing profit margins for the Saudis, and other countries disagree with this stance.
With the Saudis finally capitulating to a production cut, maybe the OPEC forces can remain aligned over the near-term. Then again, it might be a temporary fix as OPEC influence continues to slowly sink – especially now that OPEC as a whole is only the second biggest supplier of imports to the U.S., and shrinking.


Energy
Charted: 4 Reasons Why Lithium Could Be the Next Gold Rush
Visual Capitalist has partnered with EnergyX to show why drops in prices and growing demand may make now the right time to invest in lithium.


4 Reasons Why You Should Invest in Lithium
Lithium’s importance in powering EVs makes it a linchpin of the clean energy transition and one of the world’s most precious minerals.
In this graphic, Visual Capitalist partnered with EnergyX to explore why now may be the time to invest in lithium.
1. Lithium Prices Have Dropped
One of the most critical aspects of evaluating an investment is ensuring that the asset’s value is higher than its price would indicate. Lithium is integral to powering EVs, and, prices have fallen fast over the last year:
| Date | LiOH·H₂O* | Li₂CO₃** |
|---|---|---|
| Feb 2023 | $76 | $71 |
| March 2023 | $71 | $61 |
| Apr 2023 | $43 | $33 |
| May 2023 | $43 | $33 |
| June 2023 | $47 | $45 |
| July 2023 | $44 | $40 |
| Aug 2023 | $35 | $35 |
| Sept 2023 | $28 | $27 |
| Oct 2023 | $24 | $23 |
| Nov 2023 | $21 | $21 |
| Dec 2023 | $17 | $16 |
| Jan 2024 | $14 | $15 |
| Feb 2024 | $13 | $14 |
Note: Monthly spot prices were taken as close to the 14th of each month as possible.
*Lithium hydroxide monohydrate MB-LI-0033
**Lithium carbonate MB-LI-0029
2. Lithium-Ion Battery Prices Are Also Falling
The drop in lithium prices is just one reason to invest in the metal. Increasing economies of scale, coupled with low commodity prices, have caused the cost of lithium-ion batteries to drop significantly as well.
In fact, BNEF reports that between 2013 and 2023, the price of a Li-ion battery dropped by 82%.
| Year | Price per KWh |
|---|---|
| 2023 | $139 |
| 2022 | $161 |
| 2021 | $150 |
| 2020 | $160 |
| 2019 | $183 |
| 2018 | $211 |
| 2017 | $258 |
| 2016 | $345 |
| 2015 | $448 |
| 2014 | $692 |
| 2013 | $780 |

3. EV Adoption is Sustainable
One of the best reasons to invest in lithium is that EVs, one of the main drivers behind the demand for lithium, have reached a price point similar to that of traditional vehicle.
According to the Kelly Blue Book, Tesla’s average transaction price dropped by 25% between 2022 and 2023, bringing it in line with many other major manufacturers and showing that EVs are a realistic transport option from a consumer price perspective.
| Manufacturer | September 2022 | September 2023 |
|---|---|---|
| BMW | $69,000 | $72,000 |
| Ford | $54,000 | $56,000 |
| Volkswagon | $54,000 | $56,000 |
| General Motors | $52,000 | $53,000 |
| Tesla | $68,000 | $51,000 |
4. Electricity Demand in Transport is Growing
As EVs become an accessible transport option, there’s an investment opportunity in lithium. But possibly the best reason to invest in lithium is that the IEA reports global demand for the electricity in transport could grow dramatically by 2030:
| Transport Type | 2022 | 2025 | 2030 |
|---|---|---|---|
| Buses 🚌 | 23,000 GWh | 50,000 GWh | 130,000 GWh |
| Cars 🚙 | 65,000 GWh | 200,000 GWh | 570,000 GWh |
| Trucks 🛻 | 4,000 GWh | 15,000 GWh | 94,000 GWh |
| Vans 🚐 | 6,000 GWh | 16,000 GWh | 72,000 GWh |
The Lithium Investment Opportunity
Lithium presents a potentially classic investment opportunity. Lithium and battery prices have dropped significantly, and recently, EVs have reached a price point similar to other vehicles. By 2030, the demand for clean energy, especially in transport, will grow dramatically.
With prices dropping and demand skyrocketing, now is the time to invest in lithium.
EnergyX is poised to exploit lithium demand with cutting-edge lithium extraction technology capable of extracting 300% more lithium than current processes.

-

 Lithium3 days ago
Ranked: The Top 10 EV Battery Manufacturers in 2023
Asia dominates this ranking of the world’s largest EV battery manufacturers in 2023.
-

 Energy1 week ago
The World’s Biggest Nuclear Energy Producers
China has grown its nuclear capacity over the last decade, now ranking second on the list of top nuclear energy producers.
-

 Energy1 month ago
The World’s Biggest Oil Producers in 2023
Just three countries accounted for 40% of global oil production last year.
-

 Energy1 month ago
How Much Does the U.S. Depend on Russian Uranium?
Currently, Russia is the largest foreign supplier of nuclear power fuel to the U.S.
-

 Uranium2 months ago
Charted: Global Uranium Reserves, by Country
We visualize the distribution of the world’s uranium reserves by country, with 3 countries accounting for more than half of total reserves.
-

 Energy3 months ago
Visualizing the Rise of the U.S. as Top Crude Oil Producer
Over the last decade, the United States has established itself as the world’s top producer of crude oil, surpassing Saudi Arabia and Russia.


-

 Mining1 week ago
Gold vs. S&P 500: Which Has Grown More Over Five Years?
-

 Markets2 weeks ago
Ranked: The Most Valuable Housing Markets in America
-

 Money2 weeks ago
Which States Have the Highest Minimum Wage in America?
-

 AI2 weeks ago
Ranked: Semiconductor Companies by Industry Revenue Share
-

 Markets2 weeks ago
Ranked: The World’s Top Flight Routes, by Revenue
-

 Countries2 weeks ago
Population Projections: The World’s 6 Largest Countries in 2075
-

 Markets2 weeks ago
The Top 10 States by Real GDP Growth in 2023
-

 Demographics2 weeks ago
The Smallest Gender Wage Gaps in OECD Countries