Healthcare
The Amazonification of Healthcare


The Amazonification of Healthcare
The digital age is no longer about just the product – it’s equally about the customer experience.
In turn, businesses are competing on their ability to deliver quantifiable results to empowered consumers, who are:
- Informed
- Proactive
- Demanding
- Discerning
- Cost-conscious
Naturally, empowered consumers have high expectations of the services and brands they choose to integrate into their lives – and Amazon’s buying experience, which is ultra-fast, convenient, innovative, and driven by user reviews, is the perfect example of this trend in action.
This “Amazonification effect” is transforming every industry from retail to finance – and the healthcare industry is now set to change forever for both consumers and businesses.
Dreams of Amazonification
Today’s infographic comes to us from Publicis Health, and it shows the shift occurring in the healthcare space to a new outcome-based economy that is powered by an increasingly digital and data-driven experience.
It’s also led by the millennial generation, a group that is seeing buying power finally line up with their influence. These digital natives see no reason for the healthcare experience to be stuck in its old ways – they demand a fast, digital, convenient, and quantified version of healthcare along with ongoing relationships.
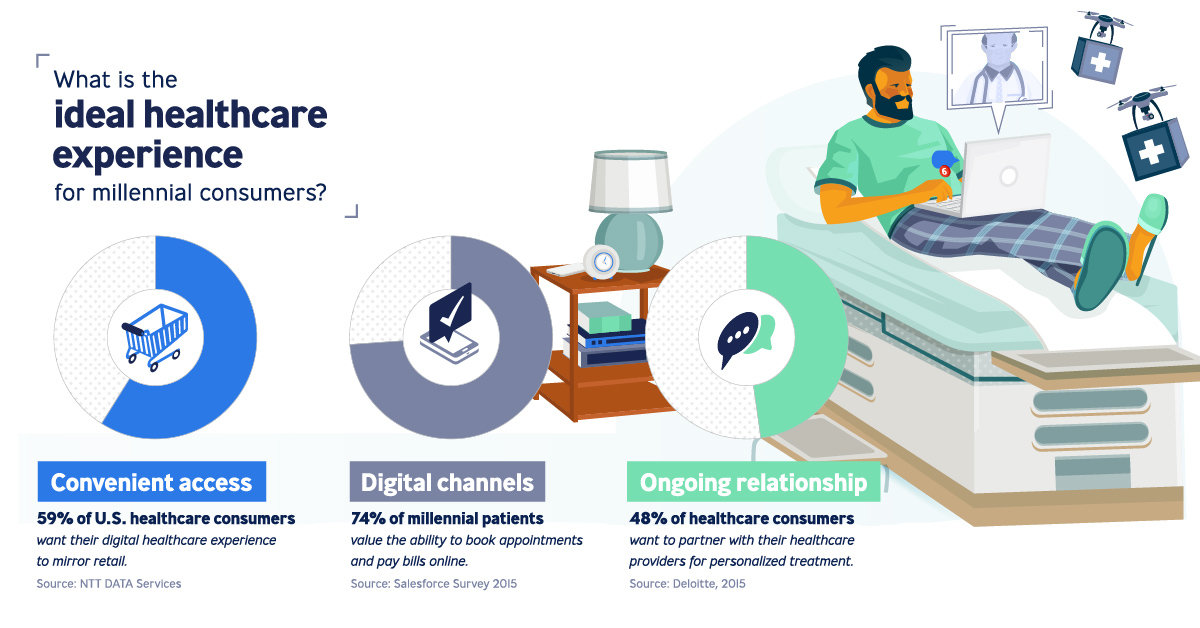
The ideal healthcare experience for this group looks something like this:
Convenient access
59% of U.S. healthcare consumers want their digital healthcare experience to mirror retail.
Digital channels
74% of millennial patients value the ability to book appointments and pay bills online.
Ongoing relationship
48% of healthcare consumers want to partner with their healthcare providers for personalized treatment.
Treating patients more like retail consumers will be a paradigm shift for healthcare – and it will require companies to invest in areas like big data to complete the patient experience.
An Ongoing Relationship
The patient-healthcare provider relationship is ever-changing.
As consumer demands grow, there is also an increased pressure on healthcare providers and pharma businesses to deliver. Patients no longer accept being told what they need, instead wanting to take more control of their health.
A more connected relationship with their healthcare provider can help achieve this goal. It’s made up of four components:
- Identify patient needs
- Uncover evolving needs by employing self-reporting to understand patterns of change
- Meet patient needs by enabling connected services for predictive interventions
- Match real life experience to treatment decisions, by using data to get a 360-degree of the patient
This can lead not only to a better patient care experience, but also better outcomes.
The Supportive Care Trifecta
An effective supportive care platform simplifies the many moving pieces that must come together in the patient care process. It leverages the following trifecta:
1. Service design
Connects services and workflows for optimal end-to-end experience, while also giving patients with the resources to engage with their own healthcare.
2. Technology activation
Backbone for delivering patient care to each stakeholder that is supported by artificial intelligence (AI) technology for a seamless experience.
3. Data intelligence
Right dashboards contribute to unearth analytic insights, revealing unique patient stories for strategic, tailored treatment.
Connecting humans with health systems, a supportive care platform links all players and workflows involved. The result? Quantifiable outcomes, and a clear return on investment.
Adopting big data in healthcare can yield:
- 20%-30% in cost savings
- 35% rise in patient access
- 20% improvement in outcomes
- 30% growth in revenue
Why it Matters
The supportive care platform drives business value by aligning collective commitments of key players in the healthcare industry.
| Stakeholder | Value | Outcomes |
|---|---|---|
| Patient | - Improved awareness - Better engagement - Personalized experience | - Increased survival rates - Better quality of life |
| Healthcare providers | - Better delivery - Improved efficiency - Improved efficacy | - Reduced hospitalization rates - More efficient, successful treatment - Increased use of resources |
| Pharma | - Leading customer and patient insight - Improved customer and patient credibility | - Improved adherence - Detailed understanding of patients |
The evolving needs of healthcare consumers call for building long-term relationships between patients and healthcare providers.
With the disruptive solution of an intelligence-powered care system, pharma companies can further these ongoing relationships and advance both patient and business outcomes.
This is part four of a seven part series. Stay tuned by subscribing to Visual Capitalist for free, as we go into these six forces in more detail in the future.


Healthcare
The Cost of an EpiPen in Major Markets
This visualization compares EpiPen prices around the world, with the U.S. having the highest prices by far.


The Cost of an EpiPen in Major Markets
This was originally posted on our Voronoi app. Download the app for free on iOS or Android and discover incredible data-driven charts from a variety of trusted sources.
EpiPens are auto-injectors containing epinephrine, a drug that can treat or reverse severe allergic reactions, potentially preventing death.
The global epinephrine market was valued at $1.75 billion in 2022 and is projected to reach $4.08 billion by 2030. North America represents over 60% of the market.
EpiPens, however, can be prohibitively expensive in some regions.
In this graphic, we present estimated EpiPen prices in major global markets, compiled by World Population Review and converted to U.S. dollars as of August 2023.
Why are U.S. Prices so High?
The U.S. stands out as the most expensive market for EpiPens, despite over 1 million Americans having epinephrine prescriptions. After Mylan (now part of Pfizer) acquired the rights to produce EpiPens in the U.S. in 2007, the cost of a two-pack skyrocketed to $600, up from about $60.
| Country | Price (USD) |
|---|---|
| 🇺🇸 U.S. | 300* |
| 🇯🇵 Japan | 98 |
| 🇩🇪 Germany | 85 |
| 🇨🇦 Canada | 80 |
| 🇫🇷 France | 76 |
| 🇦🇺 Australia | 66 |
| 🇬🇧 UK | 61 |
| 🇮🇳 India | 30 |
*Per unit cost. Commonly sold as a two-pack, meaning total cost is equal to $600
Former Mylan CEO Heather Bresch defended the price hikes to Congress, citing minimal profit margins. Mylan eventually settled with the U.S. government for a nine-figure sum.
Notably, EpiPens are available at a fraction of the cost in other developed countries like Japan, Germany, and Canada.
Making EpiPens More Affordable
Efforts to improve EpiPen affordability are underway in several U.S. states. For instance, the Colorado House approved a $60 price cap on epinephrine, now under review by the state Senate.
Similar measures in Rhode Island, Delaware, Missouri, and Vermont aim to ensure insurance coverage for epinephrine, which is not currently mandatory, although most health plans cover it.

-

 Education1 week ago
How Hard Is It to Get Into an Ivy League School?
-

 Technology2 weeks ago
Ranked: Semiconductor Companies by Industry Revenue Share
-

 Markets2 weeks ago
Ranked: The World’s Top Flight Routes, by Revenue
-

 Demographics2 weeks ago
Population Projections: The World’s 6 Largest Countries in 2075
-

 Markets2 weeks ago
The Top 10 States by Real GDP Growth in 2023
-

 Demographics2 weeks ago
The Smallest Gender Wage Gaps in OECD Countries
-

 Economy2 weeks ago
Where U.S. Inflation Hit the Hardest in March 2024
-

 Green2 weeks ago
Top Countries By Forest Growth Since 2001