Healthcare
Infographic: Which Rare Diseases Are The Most Common?
Infographic: Which Rare Diseases Are The Most Common?
Pharmaceuticals have come a long way since the apothecary days of prescribing cocaine drops for toothaches, or dispensing tapeworm diet pills.
Today, medical breakthroughs like antibiotics and vaccines save millions of lives, and contribute to the industry’s mammoth size. Yet even with rapid advancements, a select group of rare diseases still fly under the radar — and together, they affect over 350 million people worldwide.
What Are Rare Diseases?
Today’s infographic from Raconteur breaks down occurrence rates of notable rare diseases, and their collective impact on pharmaceutical drug sales. But first, let’s look at how they’re defined.
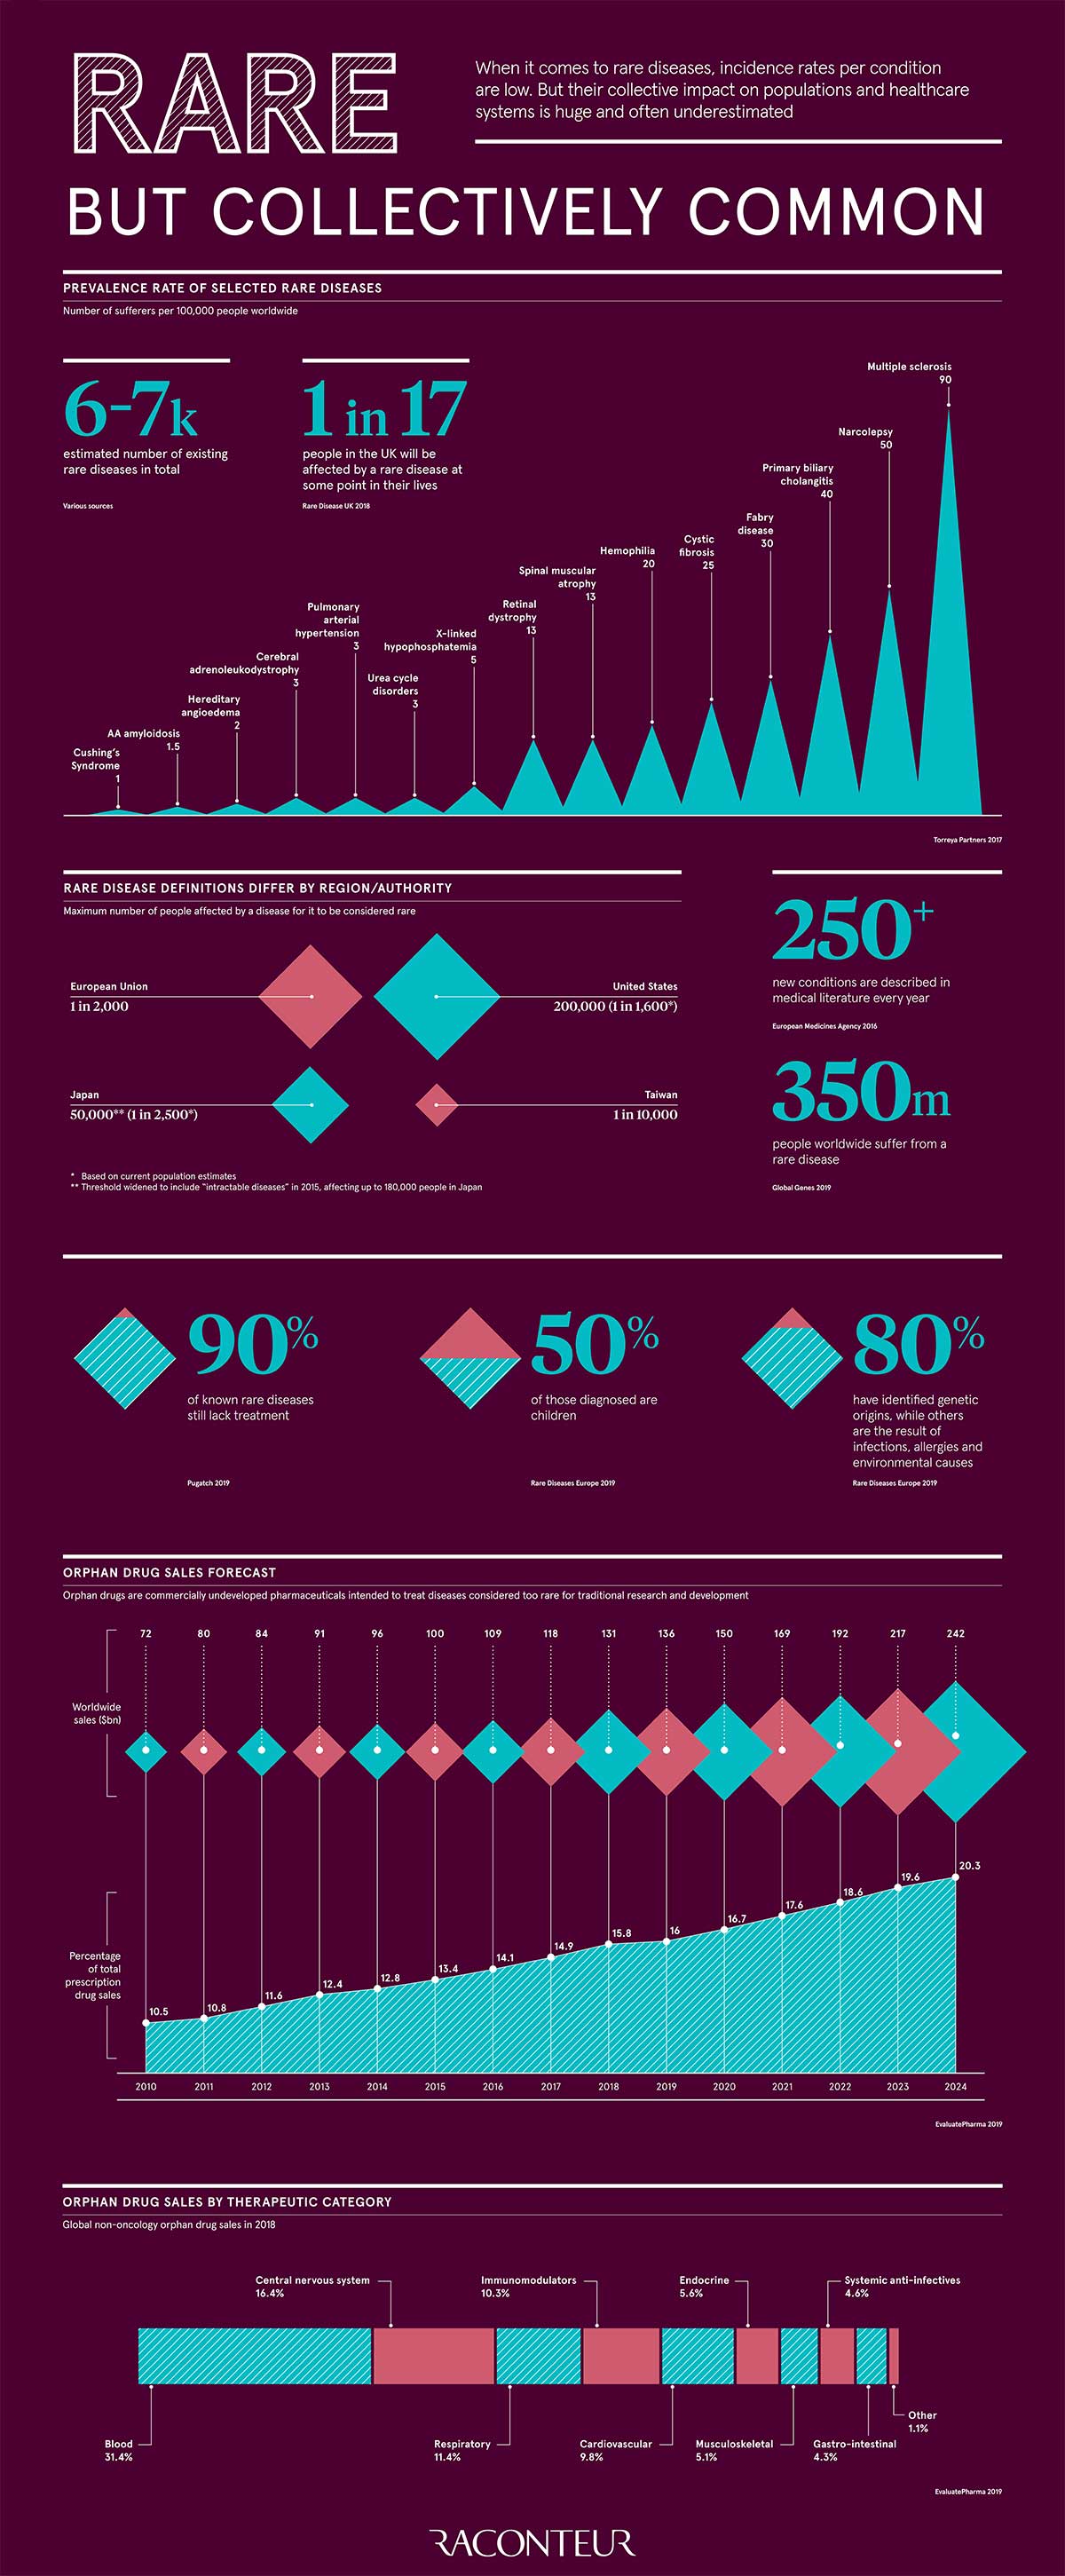
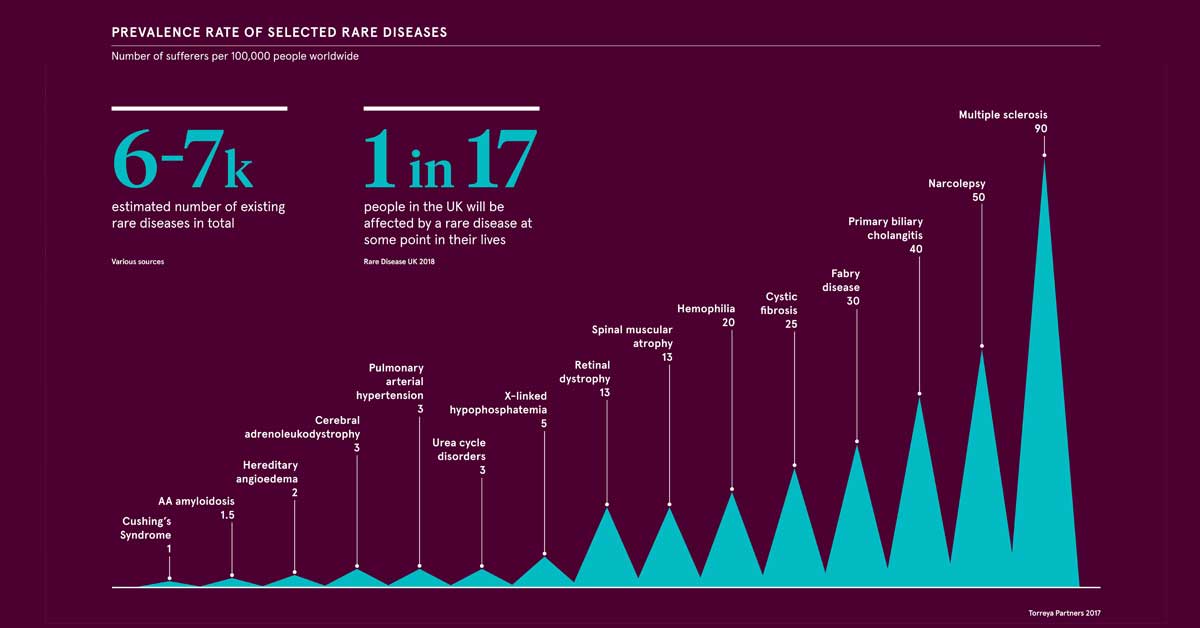
Diseases are considered rare, or “orphan” if they affect only a small proportion of the population. In general, it’s estimated that 1 in 17 people will be afflicted by a rare disease in their lifetime. At the same time, as many as 7,000 rare diseases exist, with more discovered every year.
A report by the global investment bank Torreya looks at the most common types of rare diseases that are a focus for therapeutic companies around the world:
- Multiple sclerosis emerges above all others, at 90 patients per 100,000 people.
- Narcolepsy—intermittent, uncontrollable episodes of sleepiness—affects 50 patients per 100,000.
- Primary biliary cholangitis, the damage of bile ducts in the liver, affects 40 people in 100,000.
- Rounding out the top five orphan diseases are Fabry disease (30 patients per 100,000), and cystic fibrosis (25 patients per 100,000).
One catch behind these stats? There’s actually no universal definition of what constitutes a rare disease. This means prevalence data like the above is often inconsistent, making it difficult to record the precise rate of natural occurrence.
The Cost of Rare Diseases
This gap in knowledge comes at a price—many rare diseases have constrained options for treatment. Orphan drugs are often commercially underdeveloped, as their limited end-market usage means they aren’t usually profitable enough for traditional research.
In the United States, government-backed incentives such as tax credits for R&D costs and clinical trials are speeding up the pathways from drug to market. Other places like the EU, Japan, and Australia are also following suit.
In total, it’s estimated that pharma companies focused on rare diseases are worth about half a trillion in enterprise value, roughly equal to 17.5% of the value of Big Pharma:
- Non-oncology value: $315.7B
- Oncology value: $193.1B
- Total enterprise value: $508.8B
Source: Torreya Report. Market values are for the top 31 pure play rare disease therapeutic companies.
The average cost of an orphan drug per U.S. patient annually can climb to near $151,000 (a whopping 4.5 times that of a non-orphan drug, at $34,000). That’s why the pharma industry is urgently advancing rare disease therapeutics across different categories.
Dominant Orphan Drug Sales
According to other estimates, orphan drugs are set to capture over one-fifth of global prescription sales by 2024. Blood, central nervous system, and respiratory-related drugs are currently the top therapeutic categories and are expected to keep this status into the future.
The figures below break down global orphan drug sales by therapy category, and their present and estimated future market share. Note that oncology-related orphan drug sales are excluded from this table.
| Therapy Category | 2018 Sales | Market Share | 2024E Sales | Market Share | Change in Market Share |
|---|---|---|---|---|---|
| Blood | $21.3B | 31.4% | $33.1B | 27.9% | -3.4% |
| Central nervous system (CNS) | $11.1B | 16.3% | $20.3B | 17.1% | 0.8% |
| Respiratory | $7.8B | 11.5% | $13.6B | 11.5% | 0% |
| Immunomodulators | $7B | 10.3% | $12.5B | 10.5% | 0.2% |
| Cardiovascular | $6.7B | 9.9% | $8.5B | 7.2% | -2.7% |
| Endocrine | $3.8B | 5.6% | $5.6B | 4.7% | -0.9% |
| Musculoskeletal | $3.5B | 5.2% | $11B | 9.3% | 4.1% |
| Systemic anti-infectives | $3.1B | 4.6% | $4.2B | 3.5% | -1% |
| Gastro-intestinal | $2.9B | 4.3% | $6B | 5.1% | 0.8% |
| Genito-urinary | $0.6B | 0.9% | $1.5B | 1.3% | 0.4% |
| Sensory organs | $0.1B | 0.1% | $1.5B | 1.3% | 1.1% |
| Dermatology | $0B | 0% | $0.7B | 0.6% | 0.6% |
| Total Sales | $67.9B | $118.5B |
Source: EvaluatePharma. Industry sales are based on the top 500 pharma and biotech companies.
Much is still unknown about rare diseases in the health community. Frequent misdiagnosis, and up to an average of 8 years for an accurate diagnosis, continue to be a problem for patients.
There are two sides to the situation. On one, tech giants like Microsoft are providing digital health solutions to speed up diagnosis, through machine learning and blockchain-based patient registry.
On the other, many skeptics question whether the industry is interested in finding cures for rare diseases at all, especially when they account for a significant portion of industry revenues.
Is curing patients a sustainable business model?


Healthcare
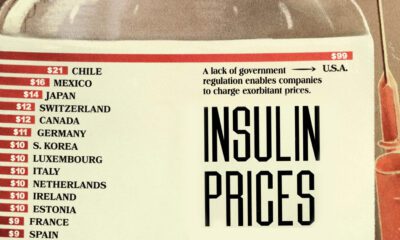
The Cost of an EpiPen in Major Markets
This visualization compares EpiPen prices around the world, with the U.S. having the highest prices by far.


The Cost of an EpiPen in Major Markets
This was originally posted on our Voronoi app. Download the app for free on iOS or Android and discover incredible data-driven charts from a variety of trusted sources.
EpiPens are auto-injectors containing epinephrine, a drug that can treat or reverse severe allergic reactions, potentially preventing death.
The global epinephrine market was valued at $1.75 billion in 2022 and is projected to reach $4.08 billion by 2030. North America represents over 60% of the market.
EpiPens, however, can be prohibitively expensive in some regions.
In this graphic, we present estimated EpiPen prices in major global markets, compiled by World Population Review and converted to U.S. dollars as of August 2023.
Why are U.S. Prices so High?
The U.S. stands out as the most expensive market for EpiPens, despite over 1 million Americans having epinephrine prescriptions. After Mylan (now part of Pfizer) acquired the rights to produce EpiPens in the U.S. in 2007, the cost of a two-pack skyrocketed to $600, up from about $60.
| Country | Price (USD) |
|---|---|
| 🇺🇸 U.S. | 300* |
| 🇯🇵 Japan | 98 |
| 🇩🇪 Germany | 85 |
| 🇨🇦 Canada | 80 |
| 🇫🇷 France | 76 |
| 🇦🇺 Australia | 66 |
| 🇬🇧 UK | 61 |
| 🇮🇳 India | 30 |
*Per unit cost. Commonly sold as a two-pack, meaning total cost is equal to $600
Former Mylan CEO Heather Bresch defended the price hikes to Congress, citing minimal profit margins. Mylan eventually settled with the U.S. government for a nine-figure sum.
Notably, EpiPens are available at a fraction of the cost in other developed countries like Japan, Germany, and Canada.
Making EpiPens More Affordable
Efforts to improve EpiPen affordability are underway in several U.S. states. For instance, the Colorado House approved a $60 price cap on epinephrine, now under review by the state Senate.
Similar measures in Rhode Island, Delaware, Missouri, and Vermont aim to ensure insurance coverage for epinephrine, which is not currently mandatory, although most health plans cover it.

-

 Education1 week ago
How Hard Is It to Get Into an Ivy League School?
-

 Technology2 weeks ago
Ranked: Semiconductor Companies by Industry Revenue Share
-

 Markets2 weeks ago
Ranked: The World’s Top Flight Routes, by Revenue
-

 Demographics2 weeks ago
Population Projections: The World’s 6 Largest Countries in 2075
-

 Markets2 weeks ago
The Top 10 States by Real GDP Growth in 2023
-

 Demographics2 weeks ago
The Smallest Gender Wage Gaps in OECD Countries
-

 Economy2 weeks ago
Where U.S. Inflation Hit the Hardest in March 2024
-

 Green2 weeks ago
Top Countries By Forest Growth Since 2001