Economy
Visualizing China’s $18 Trillion Economy in One Chart


Visualizing China’s $18 Trillion Economy in 2021
China is the world’s second largest economy after the U.S., and it is expected to eventually climb into the number one position in the coming decades.
While China’s economy has had a much rockier start this year due to zero-tolerance COVID-19 lockdowns and supply chain issues, our visualization covers a full year of data for 2021—a year in which most economies recovered after the initial chaos of the pandemic.
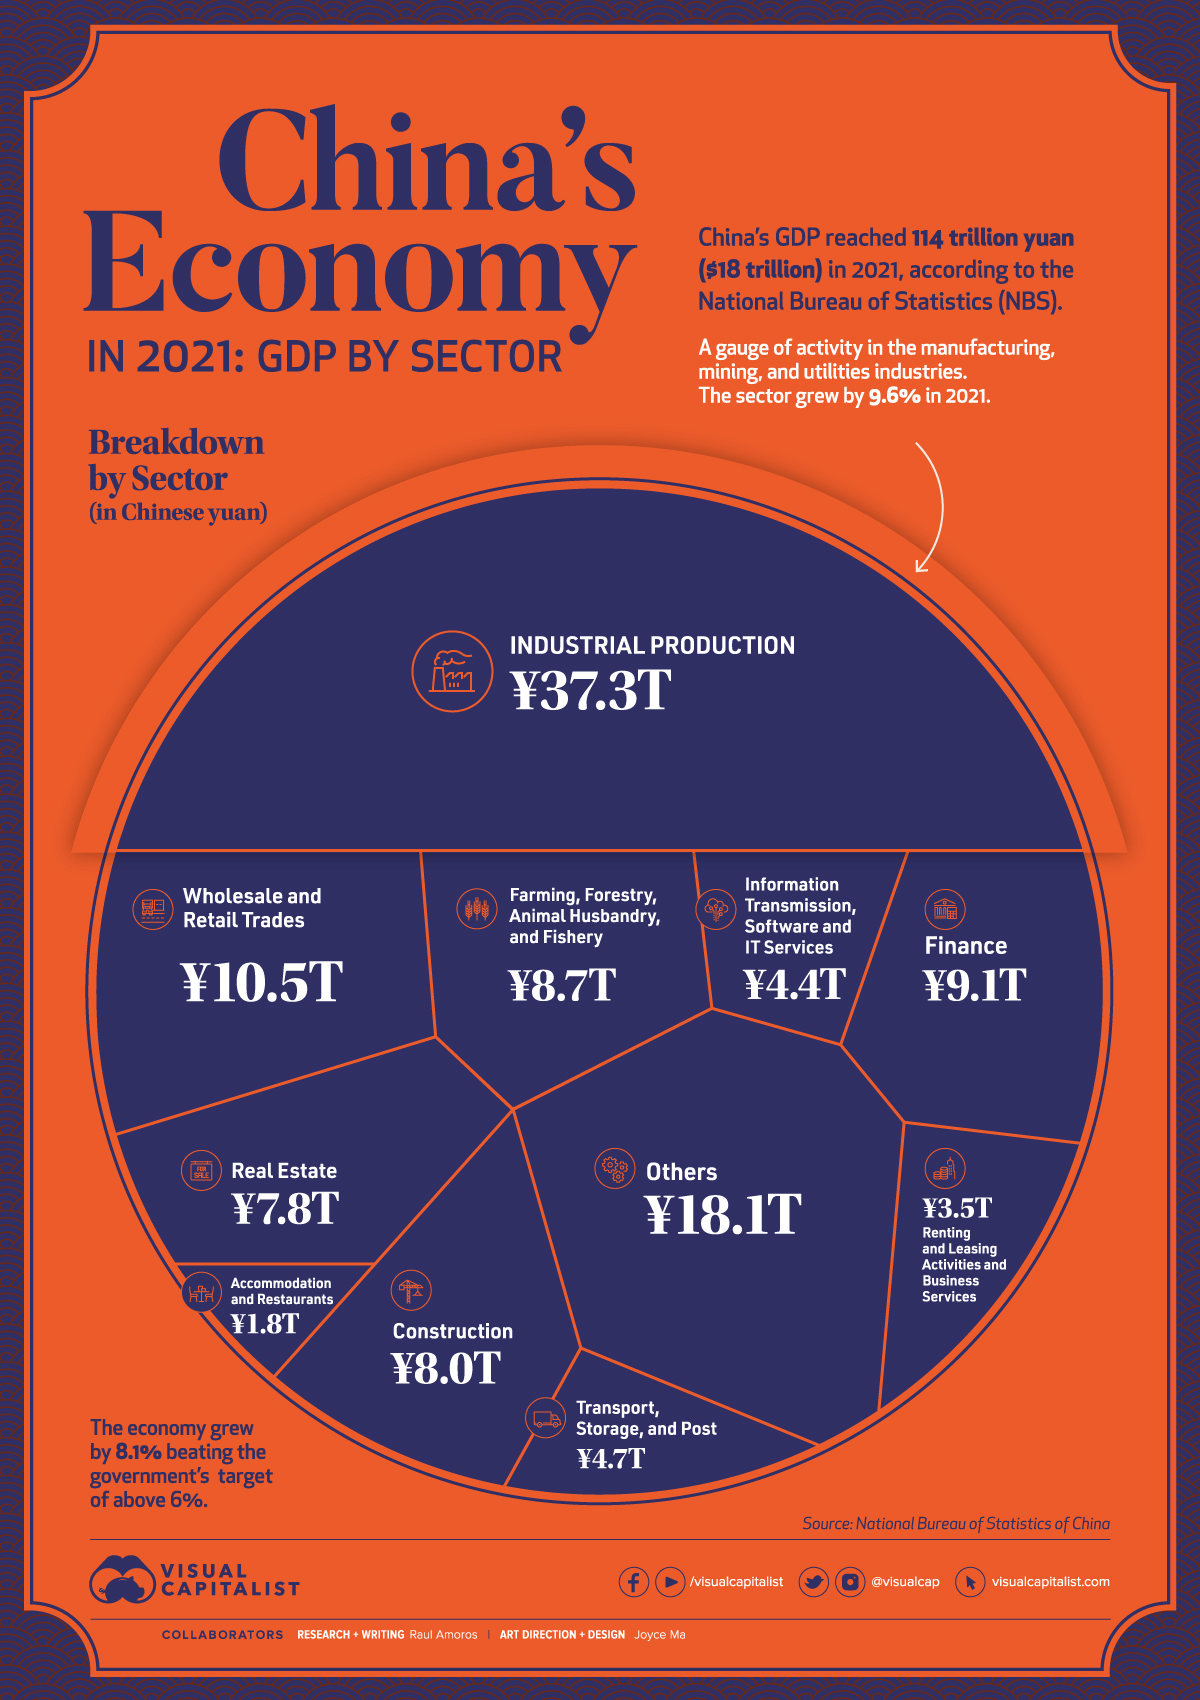
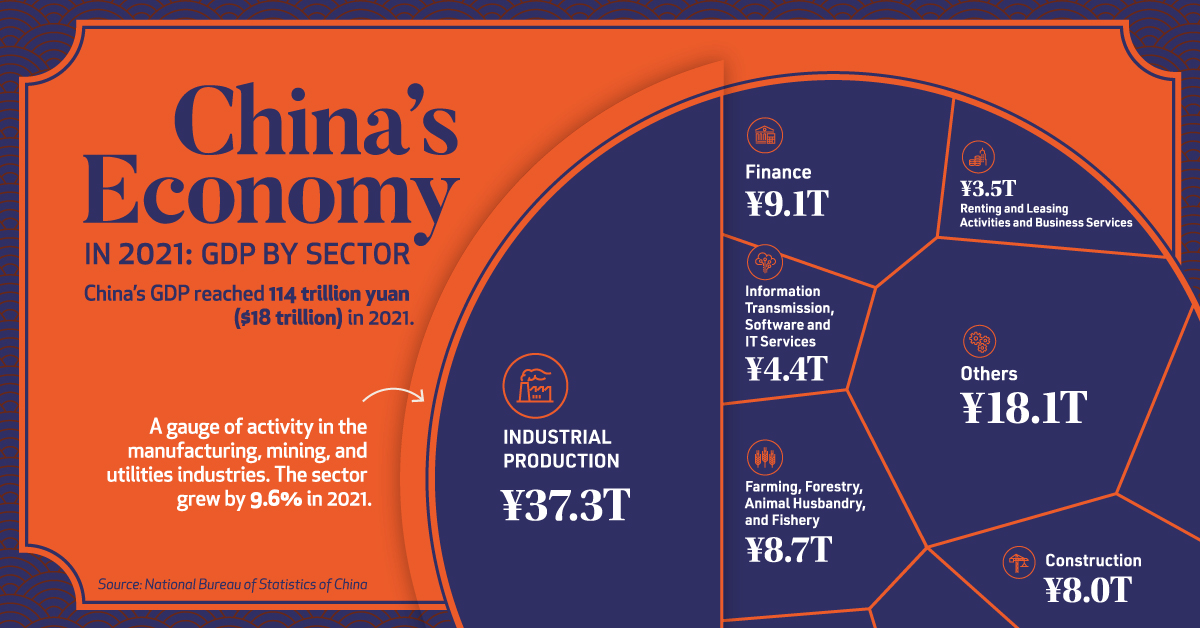
In 2021, China’s Gross Domestic Product (GDP) reached ¥114 trillion ($18 trillion in USD), according to the National Bureau of Statistics. The country’s economy outperformed government targets of 6% growth, with the overall economy growing by 8.1%.
Let’s take a look at what powers China’s modern economy.
Breaking Down China’s Economy By Sector
| Sector | 2021 Total GDP (Yuan) | 2021 Total GDP (USD) | % Share |
|---|---|---|---|
| Industry | ¥37.3T | $5.9T | 32.6% |
| Wholesale and Retail Trades | ¥10.5T | $1.7T | 9.2% |
| Finance | ¥9.1T | $1.4T | 8.0% |
| Farming, Forestry, Animal Husbandry, and Fishery | ¥8.7T | $1.4T | 7.6% |
| Construction | ¥8.0T | $1.3T | 7.0% |
| Real Estate | ¥7.8T | $1.2T | 6.9% |
| Transport, Storage, and Post | ¥4.7T | $0.7T | 4.1% |
| Information Transmission, Software and IT Services | ¥4.4T | $0.7T | 3.9% |
| Renting & Leasing Activities and Business Services | ¥3.5T | $0.6T | 3.1% |
| Accommodation and Restaurants | ¥1.8T | $0.3T | 1.6% |
| Others | ¥18.1T | $2.8T | 15.9% |
| Total | ¥114T | ¥18T | 100.0% |
Industrial production—activity in the manufacturing, mining, and utilities sectors—is by far the leading driver of China’s economy. In 2021, the sector generated ¥37.3 trillion, or one-third of the country’s total economic activity.
Despite a slowdown in December, wholesale and retail trades also performed strongly in 2021. As the main gauge of consumption, it was affected by lockdown measures and the spread of the COVID-19 Omicron variant towards the end of the year, but still rose by double digits, reaching a total of ¥10.5 trillion*.
“Other services”, which includes everything from scientific research and development to education and social services, generated 16% of China’s total economy in 2021, or ¥18.1 trillion.
*Editor’s note: At time of publishing, China’s government seems to have since adjusted this number to ¥11.0 trillion, which is not consistent with the original data set provided, but worth noting.
Where is China’s GDP Headed?
China’s economy recovered noticeably faster than most major economies last year, and as the overall trend below shows, the country has grown consistently in the years prior.
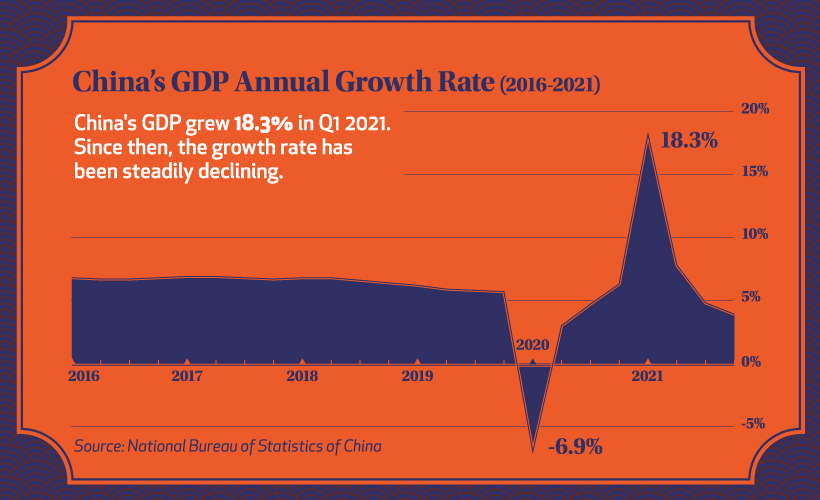
Before the pandemic hit, China’s quarterly GDP growth had been quite stable at just above 5%.
After the initial onset of COVID-19, the country’s economy faltered, mirroring economies around the globe. But after a strong recovery into 2021, resurging cases caused a new series of crackdowns on the private sector, slowing down GDP growth considerably.
With the slowdown continuing into early 2022, China’s economic horizon still looks uncertain. The lockdown in Shanghai is expected to continue all the way to June 1st, and over recent months there have been hundreds of ships stuck outside of Shanghai’s port as a part of ongoing supply chain challenges.
China’s Zero-COVID Policy: Good or Bad for the Economy?
While every country reacted to the COVID-19 pandemic differently, China adopted a zero-COVID policy of strict lockdowns to control cases and outbreaks.
For most of 2021, the policy didn’t deter GDP growth. Despite some major cities fully or partially locked down to control regional outbreaks, the country’s economy still paced well ahead of many other major economies.
But the policy faced a challenge with the emergence of the Omicron variant. Despite lockdowns and an 88% vaccination rate nationally, seven out of China’s 31 provinces and all of the biggest cities have reported Omicron cases.
And China’s zero-COVID policy has not affected all sectors equally. Industrial production rose by more than 10% in the first 11 months of 2021, despite city lockdowns around the country. That’s because many factories in China are in suburban industrial parks outside the cities, and employees often live nearby.
But many sectors like hotels and restaurants have been more severely affected by city lockdowns. Many global economies are starting to transition to living with COVID, with China remaining as one of the last countries to follow a zero-COVID policy. Does that ensure the country’s economy will continue to slow in 2022, or will China manage to recover and maintain one of the world’s fastest growing economies?


Economy
Economic Growth Forecasts for G7 and BRICS Countries in 2024
The IMF has released its economic growth forecasts for 2024. How do the G7 and BRICS countries compare?


G7 & BRICS Real GDP Growth Forecasts for 2024
The International Monetary Fund’s (IMF) has released its real gross domestic product (GDP) growth forecasts for 2024, and while global growth is projected to stay steady at 3.2%, various major nations are seeing declining forecasts.
This chart visualizes the 2024 real GDP growth forecasts using data from the IMF’s 2024 World Economic Outlook for G7 and BRICS member nations along with Saudi Arabia, which is still considering an invitation to join the bloc.
Get the Key Insights of the IMF’s World Economic Outlook
Want a visual breakdown of the insights from the IMF’s 2024 World Economic Outlook report?
This visual is part of a special dispatch of the key takeaways exclusively for VC+ members.
Get the full dispatch of charts by signing up to VC+.
Mixed Economic Growth Prospects for Major Nations in 2024
Economic growth projections by the IMF for major nations are mixed, with the majority of G7 and BRICS countries forecasted to have slower growth in 2024 compared to 2023.
Only three BRICS-invited or member countries, Saudi Arabia, the UAE, and South Africa, have higher projected real GDP growth rates in 2024 than last year.
| Group | Country | Real GDP Growth (2023) | Real GDP Growth (2024P) |
|---|---|---|---|
| G7 | 🇺🇸 U.S. | 2.5% | 2.7% |
| G7 | 🇨🇦 Canada | 1.1% | 1.2% |
| G7 | 🇯🇵 Japan | 1.9% | 0.9% |
| G7 | 🇫🇷 France | 0.9% | 0.7% |
| G7 | 🇮🇹 Italy | 0.9% | 0.7% |
| G7 | 🇬🇧 UK | 0.1% | 0.5% |
| G7 | 🇩🇪 Germany | -0.3% | 0.2% |
| BRICS | 🇮🇳 India | 7.8% | 6.8% |
| BRICS | 🇨🇳 China | 5.2% | 4.6% |
| BRICS | 🇦🇪 UAE | 3.4% | 3.5% |
| BRICS | 🇮🇷 Iran | 4.7% | 3.3% |
| BRICS | 🇷🇺 Russia | 3.6% | 3.2% |
| BRICS | 🇪🇬 Egypt | 3.8% | 3.0% |
| BRICS-invited | 🇸🇦 Saudi Arabia | -0.8% | 2.6% |
| BRICS | 🇧🇷 Brazil | 2.9% | 2.2% |
| BRICS | 🇿🇦 South Africa | 0.6% | 0.9% |
| BRICS | 🇪🇹 Ethiopia | 7.2% | 6.2% |
| 🌍 World | 3.2% | 3.2% |
China and India are forecasted to maintain relatively high growth rates in 2024 at 4.6% and 6.8% respectively, but compared to the previous year, China is growing 0.6 percentage points slower while India is an entire percentage point slower.
On the other hand, four G7 nations are set to grow faster than last year, which includes Germany making its comeback from its negative real GDP growth of -0.3% in 2023.
Faster Growth for BRICS than G7 Nations
Despite mostly lower growth forecasts in 2024 compared to 2023, BRICS nations still have a significantly higher average growth forecast at 3.6% compared to the G7 average of 1%.
While the G7 countries’ combined GDP is around $15 trillion greater than the BRICS nations, with continued higher growth rates and the potential to add more members, BRICS looks likely to overtake the G7 in economic size within two decades.
BRICS Expansion Stutters Before October 2024 Summit
BRICS’ recent expansion has stuttered slightly, as Argentina’s newly-elected president Javier Milei declined its invitation and Saudi Arabia clarified that the country is still considering its invitation and has not joined BRICS yet.
Even with these initial growing pains, South Africa’s Foreign Minister Naledi Pandor told reporters in February that 34 different countries have submitted applications to join the growing BRICS bloc.
Any changes to the group are likely to be announced leading up to or at the 2024 BRICS summit which takes place October 22-24 in Kazan, Russia.
Get the Full Analysis of the IMF’s Outlook on VC+
This visual is part of an exclusive special dispatch for VC+ members which breaks down the key takeaways from the IMF’s 2024 World Economic Outlook.
For the full set of charts and analysis, sign up for VC+.

-

 Mining1 week ago
Gold vs. S&P 500: Which Has Grown More Over Five Years?
-

 Markets2 weeks ago
Ranked: The Most Valuable Housing Markets in America
-

 Money2 weeks ago
Which States Have the Highest Minimum Wage in America?
-

 AI2 weeks ago
Ranked: Semiconductor Companies by Industry Revenue Share
-

 Markets2 weeks ago
Ranked: The World’s Top Flight Routes, by Revenue
-

 Countries2 weeks ago
Population Projections: The World’s 6 Largest Countries in 2075
-

 Markets2 weeks ago
The Top 10 States by Real GDP Growth in 2023
-

 Demographics2 weeks ago
The Smallest Gender Wage Gaps in OECD Countries