Economy
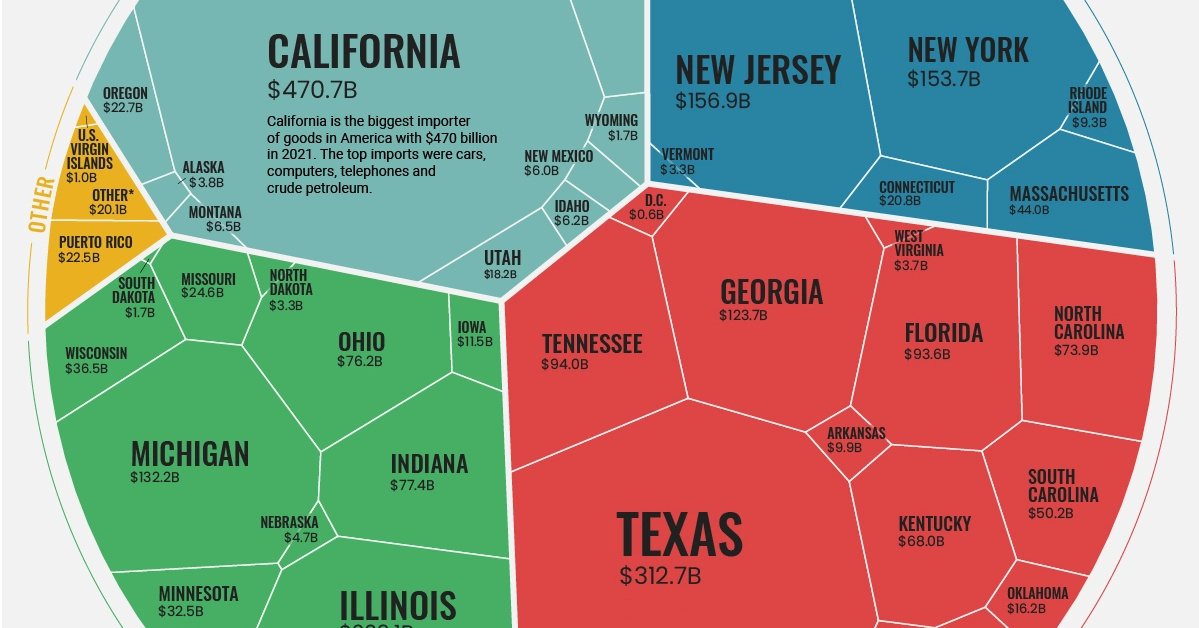
Visualized: The Value of U.S. Imports of Goods by State
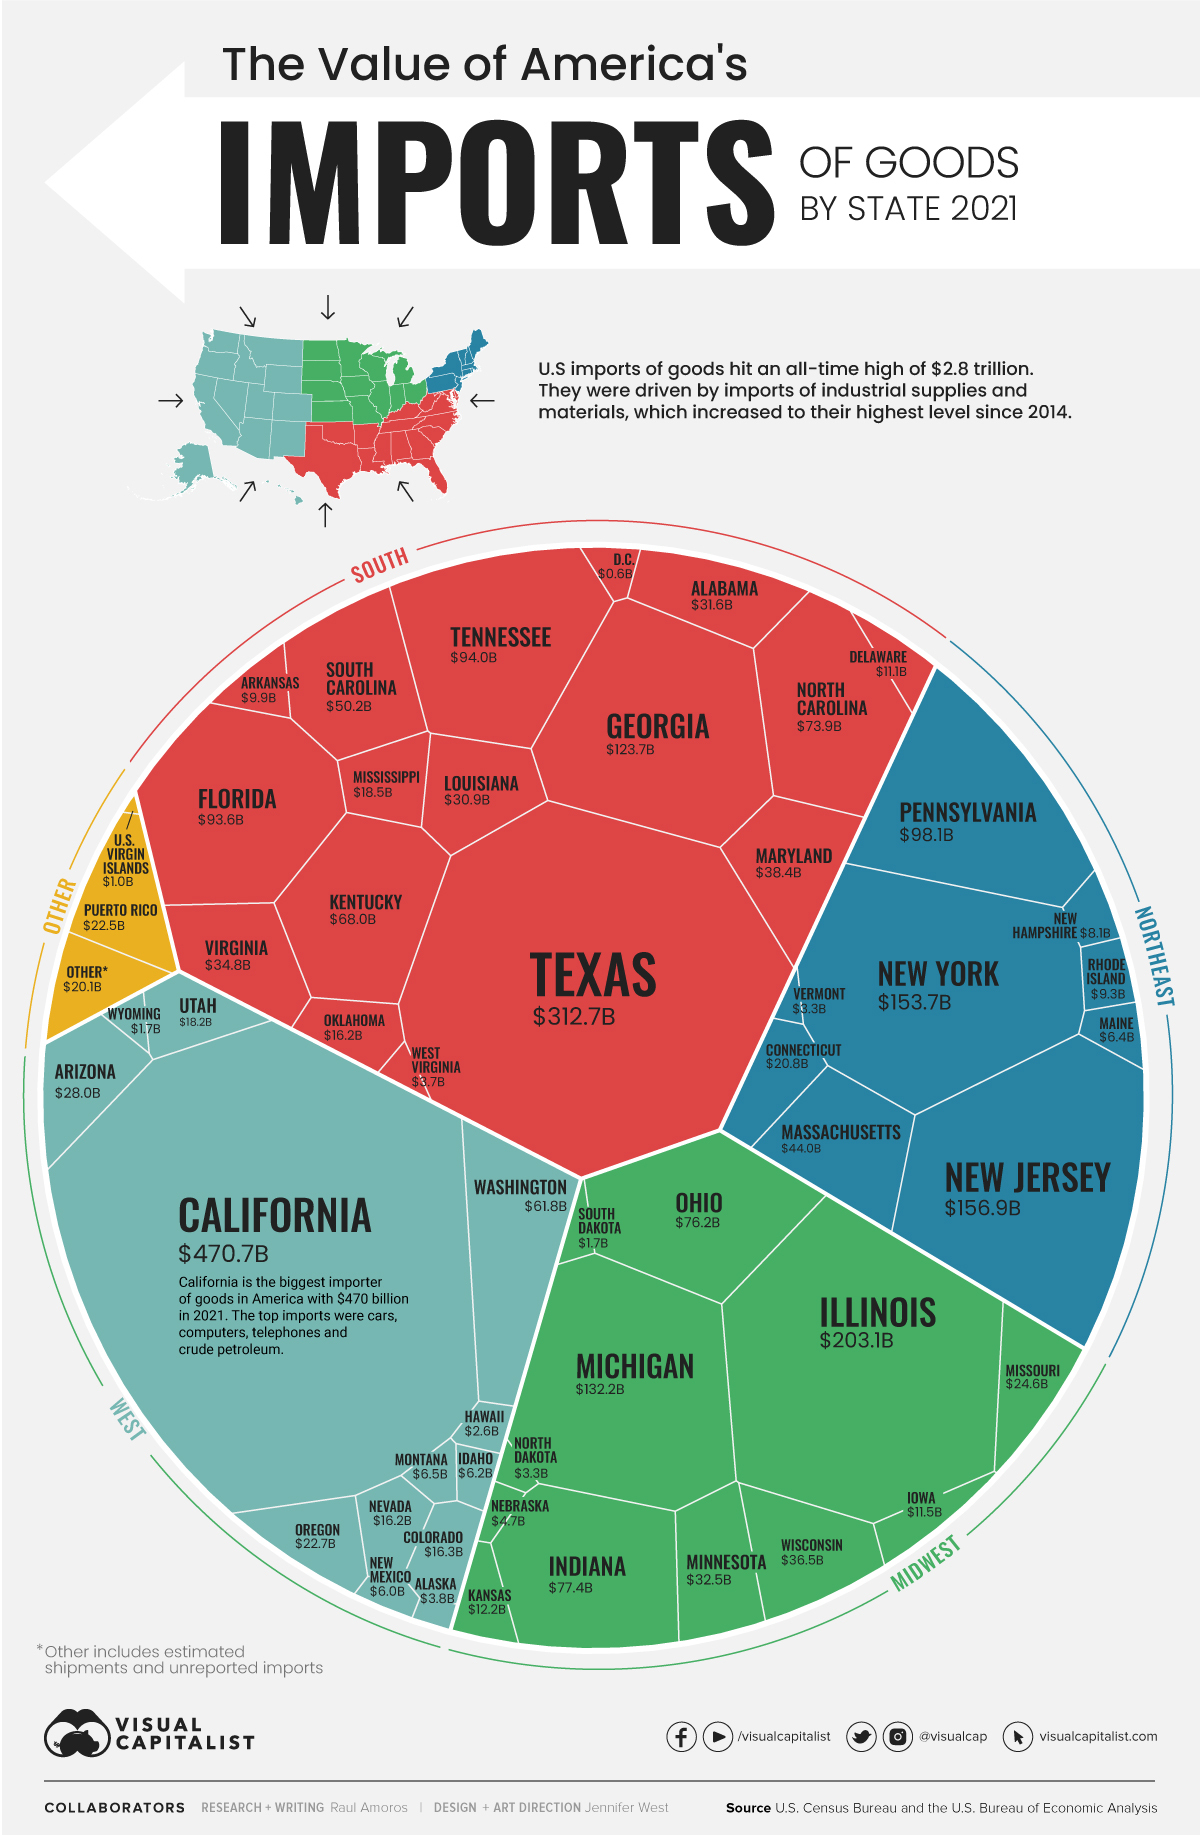
Visualized: The Value of U.S. Imports of Goods by State 2021
For nearly 50 years and counting, U.S. imports have exceeded exports—and 2021 was no exception. Imports of goods to the U.S. equaled $2.8 trillion, relative to $1.8 trillion for exports, putting the 2021 goods trade deficit at its highest level on record.
Using the most recent data on global trade from the U.S. Census Bureau and the U.S. Bureau of Economic Analysis, we take a closer look at the value of American goods imports and visualize them state by state.
The Top 10 Importing States, by Total Goods Value
The top 10 states by import value account for 64.5% of all U.S. imports, or $1.8 trillion.
| Rank | State | Import Value ($B) | Share (%) |
|---|---|---|---|
| #1 | California | $470.7 | 16.5% |
| #2 | Texas | $312.6 | 11.0% |
| #3 | Illinois | $203.1 | 7.1% |
| #4 | New Jersey | $156.9 | 5.5% |
| #5 | New York | $153.7 | 5.4% |
| #6 | Michigan | $132.2 | 4.6% |
| #7 | Georgia | $123.7 | 4.3% |
| #8 | Pennsylvania | $98.1 | 3.4% |
| #9 | Tennessee | $94.0 | 3.3% |
| #10 | Florida | $93.6 | 3.3% |
| Top 10 States | $1,838.6 | 64.5% |
Overall, the goods trade deficit—the amount by which a country’s imports exceed its exports—was more than $1 trillion in 2021, increasing over 18% from the previous year. Goods imports specifically increased by nearly $502 billion, a 21% increase year-over-year.
California, the U.S.’s top importer, saw over $470 billion worth of goods come in last year. Some of its big ticket items fell in line with the state’s tech sector’s needs, like automatic data processing machines and accessories and parts for said machinery. California’s own deficit is quite high—the state’s goods exports were only valued at approximately $175 billion. The state’s busy ports are a key entry point for goods arriving from Asia, which helps explain this deficit.
In contrast, the country’s top export state is Texas at $375 billion, outweighing its imports and shipping out goods like coal and petroleum. All but three of the country’s top importers—Tennessee, Pennsylvania, and Georgia—were also among the country’s top 10 exporters.
Where are Imports Coming From?
Here’s a look at the country’s top trade partners for goods imports and the value of their imports in 2022 as of April.
| Rank | Country | Import Value ($B) as of April '22 | Share of Total |
|---|---|---|---|
| #1 | 🇨🇳 China | $179.3 | 17.0% |
| #2 | 🇲🇽 Mexico | $145.1 | 13.8% |
| #3 | 🇨🇦 Canada | $141.7 | 13.5% |
| #4 | 🇯🇵 Japan | $49.6 | 4.7% |
| #5 | 🇩🇪 Germany | $44.2 | 4.2% |
| #6 | 🇻🇳 Vietnam | $40.5 | 3.8% |
| #7 | 🇰🇷 South Korea | $36.5 | 3.5% |
| #8 | 🇹🇼 Taiwan | $29.6 | 2.8% |
| #9 | 🇮🇳 India | $27.5 | 2.6% |
| #10 | 🇮🇪 Ireland | $26.5 | 2.5% |
Over half of the top import partners for the United States are located in Asia. China is by far America’s top source of goods, making up 17% of the country’s imports.
Meanwhile, Canada and Mexico each account for roughly 14% of America’s goods imports due to the close proximity, strong economic ties, and trade agreements.
What’s Being Imported?
Imports of goods increased to a value of $2.8 trillion in 2021, the highest on record. According to the U.S. Census Bureau, industrial supplies and materials and crude oil saw some of the most notable increases.
Consumer goods like cell phones, household goods, toys, games, and sporting equipment increased in import value as well, reflecting a trend that the pandemic’s online shopping and delivery demand started.
Additionally, imports of foods, feeds, and beverages were the highest on record in 2021. It is also notable that in April of 2022, exports of goods hit the highest number on record at nearly $175 billion, with exports of feeds, food, and beverage also reaching the highest number of exports recorded. This is likely attributed to food shortages worldwide caused by the war in Ukraine.


Economy
Economic Growth Forecasts for G7 and BRICS Countries in 2024
The IMF has released its economic growth forecasts for 2024. How do the G7 and BRICS countries compare?


G7 & BRICS Real GDP Growth Forecasts for 2024
The International Monetary Fund’s (IMF) has released its real gross domestic product (GDP) growth forecasts for 2024, and while global growth is projected to stay steady at 3.2%, various major nations are seeing declining forecasts.
This chart visualizes the 2024 real GDP growth forecasts using data from the IMF’s 2024 World Economic Outlook for G7 and BRICS member nations along with Saudi Arabia, which is still considering an invitation to join the bloc.
Get the Key Insights of the IMF’s World Economic Outlook
Want a visual breakdown of the insights from the IMF’s 2024 World Economic Outlook report?
This visual is part of a special dispatch of the key takeaways exclusively for VC+ members.
Get the full dispatch of charts by signing up to VC+.
Mixed Economic Growth Prospects for Major Nations in 2024
Economic growth projections by the IMF for major nations are mixed, with the majority of G7 and BRICS countries forecasted to have slower growth in 2024 compared to 2023.
Only three BRICS-invited or member countries, Saudi Arabia, the UAE, and South Africa, have higher projected real GDP growth rates in 2024 than last year.
| Group | Country | Real GDP Growth (2023) | Real GDP Growth (2024P) |
|---|---|---|---|
| G7 | 🇺🇸 U.S. | 2.5% | 2.7% |
| G7 | 🇨🇦 Canada | 1.1% | 1.2% |
| G7 | 🇯🇵 Japan | 1.9% | 0.9% |
| G7 | 🇫🇷 France | 0.9% | 0.7% |
| G7 | 🇮🇹 Italy | 0.9% | 0.7% |
| G7 | 🇬🇧 UK | 0.1% | 0.5% |
| G7 | 🇩🇪 Germany | -0.3% | 0.2% |
| BRICS | 🇮🇳 India | 7.8% | 6.8% |
| BRICS | 🇨🇳 China | 5.2% | 4.6% |
| BRICS | 🇦🇪 UAE | 3.4% | 3.5% |
| BRICS | 🇮🇷 Iran | 4.7% | 3.3% |
| BRICS | 🇷🇺 Russia | 3.6% | 3.2% |
| BRICS | 🇪🇬 Egypt | 3.8% | 3.0% |
| BRICS-invited | 🇸🇦 Saudi Arabia | -0.8% | 2.6% |
| BRICS | 🇧🇷 Brazil | 2.9% | 2.2% |
| BRICS | 🇿🇦 South Africa | 0.6% | 0.9% |
| BRICS | 🇪🇹 Ethiopia | 7.2% | 6.2% |
| 🌍 World | 3.2% | 3.2% |
China and India are forecasted to maintain relatively high growth rates in 2024 at 4.6% and 6.8% respectively, but compared to the previous year, China is growing 0.6 percentage points slower while India is an entire percentage point slower.
On the other hand, four G7 nations are set to grow faster than last year, which includes Germany making its comeback from its negative real GDP growth of -0.3% in 2023.
Faster Growth for BRICS than G7 Nations
Despite mostly lower growth forecasts in 2024 compared to 2023, BRICS nations still have a significantly higher average growth forecast at 3.6% compared to the G7 average of 1%.
While the G7 countries’ combined GDP is around $15 trillion greater than the BRICS nations, with continued higher growth rates and the potential to add more members, BRICS looks likely to overtake the G7 in economic size within two decades.
BRICS Expansion Stutters Before October 2024 Summit
BRICS’ recent expansion has stuttered slightly, as Argentina’s newly-elected president Javier Milei declined its invitation and Saudi Arabia clarified that the country is still considering its invitation and has not joined BRICS yet.
Even with these initial growing pains, South Africa’s Foreign Minister Naledi Pandor told reporters in February that 34 different countries have submitted applications to join the growing BRICS bloc.
Any changes to the group are likely to be announced leading up to or at the 2024 BRICS summit which takes place October 22-24 in Kazan, Russia.
Get the Full Analysis of the IMF’s Outlook on VC+
This visual is part of an exclusive special dispatch for VC+ members which breaks down the key takeaways from the IMF’s 2024 World Economic Outlook.
For the full set of charts and analysis, sign up for VC+.

-

 Mining1 week ago
Gold vs. S&P 500: Which Has Grown More Over Five Years?
-

 Markets2 weeks ago
Ranked: The Most Valuable Housing Markets in America
-

 Money2 weeks ago
Which States Have the Highest Minimum Wage in America?
-

 AI2 weeks ago
Ranked: Semiconductor Companies by Industry Revenue Share
-

 Markets2 weeks ago
Ranked: The World’s Top Flight Routes, by Revenue
-

 Countries2 weeks ago
Population Projections: The World’s 6 Largest Countries in 2075
-

 Markets2 weeks ago
The Top 10 States by Real GDP Growth in 2023
-

 Demographics2 weeks ago
The Smallest Gender Wage Gaps in OECD Countries