Politics
U.S. Presidential Voting History from 1976-2020 (Animated Map)
How to Use: The below maps will animate automatically. To pause, move your cursor on the image. Arrows on left/right navigate.


U.S. Presidential Voting History by State
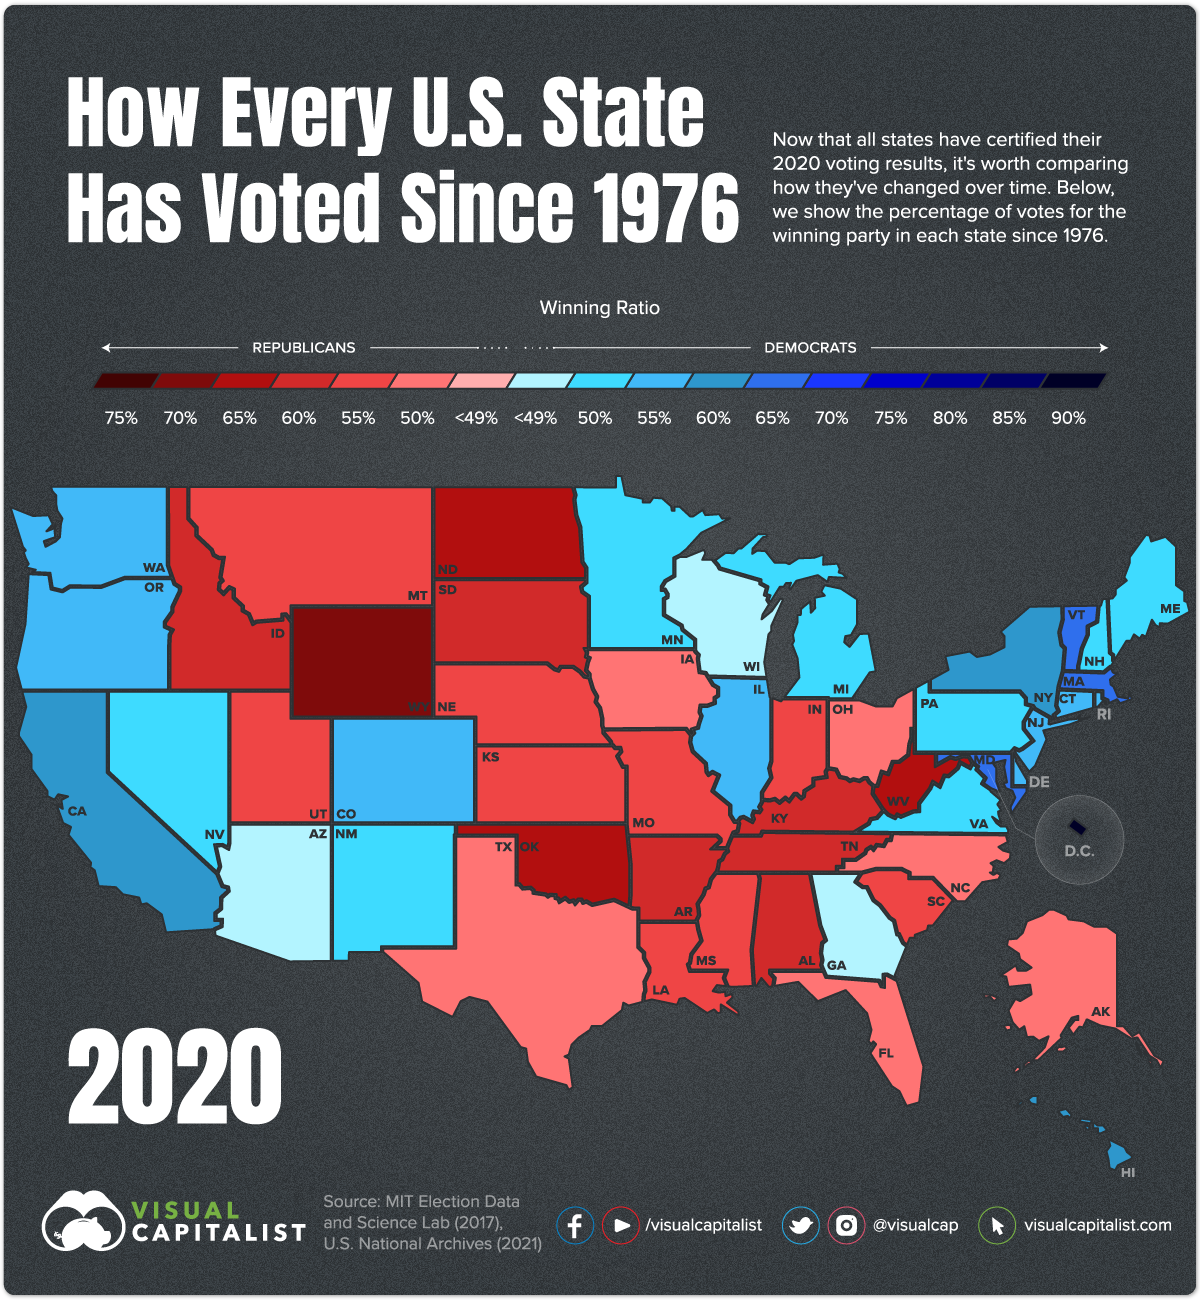
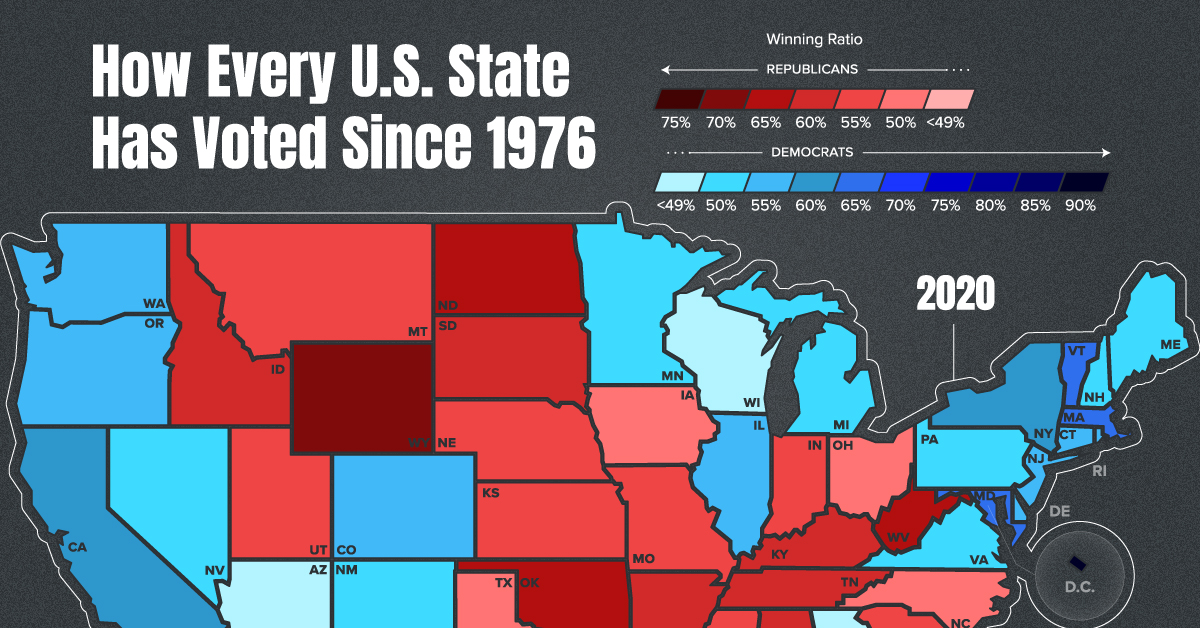
After a tumultuous election, all states have now certified their 2020 presidential voting results. Which states changed party allegiance, and how do the results compare to previous years?
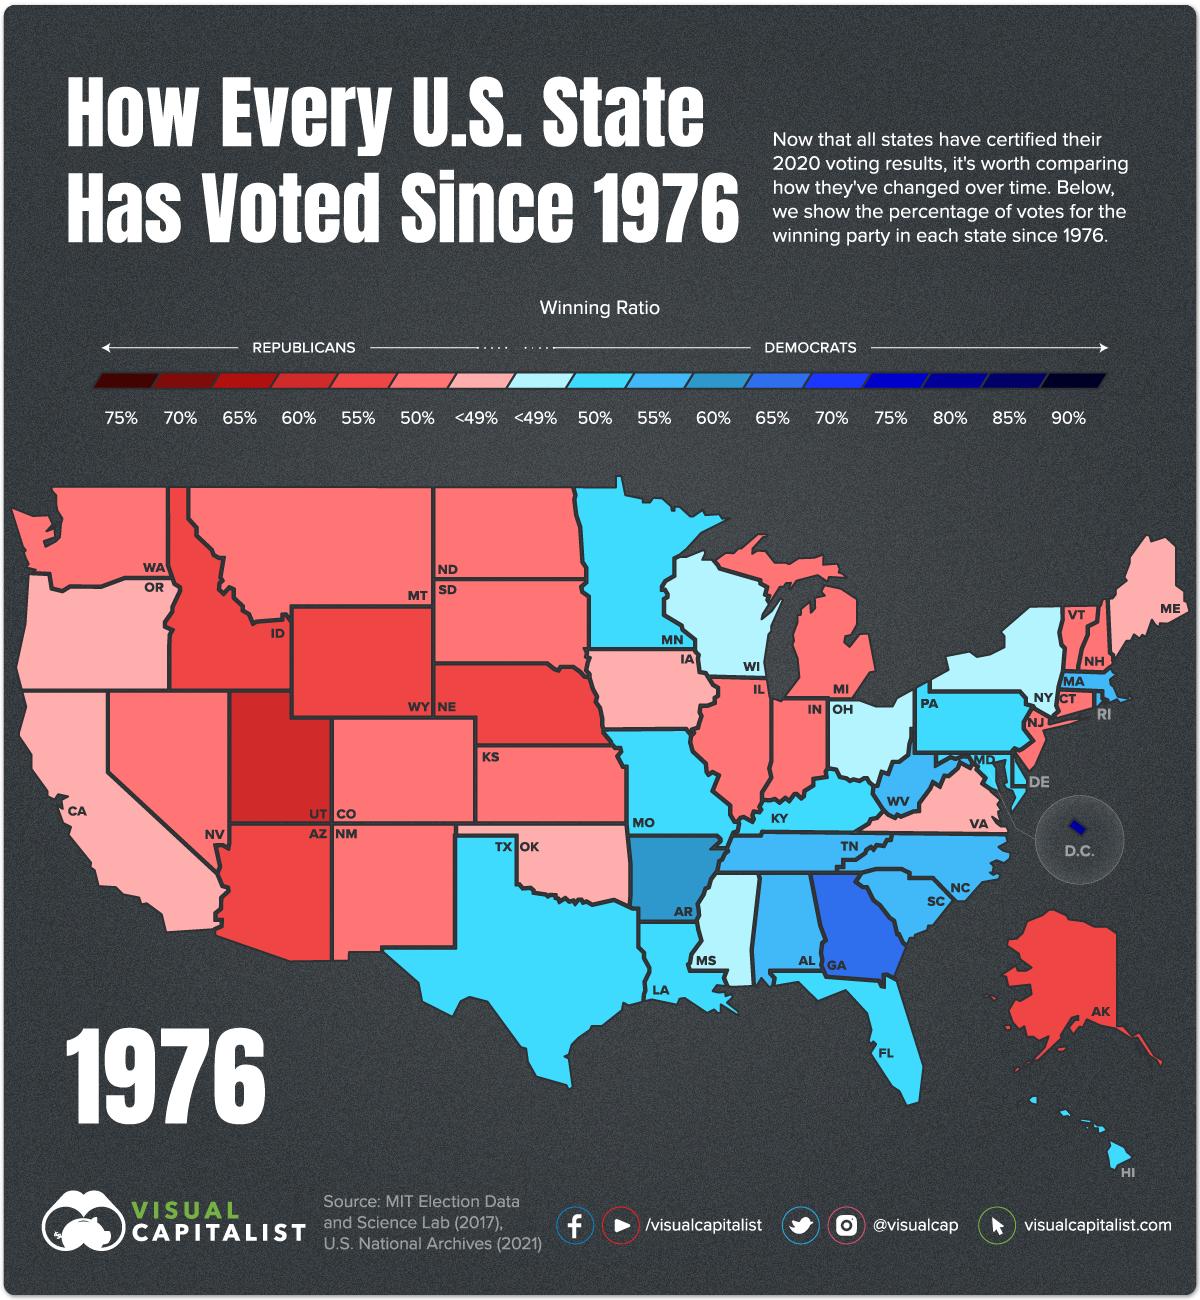
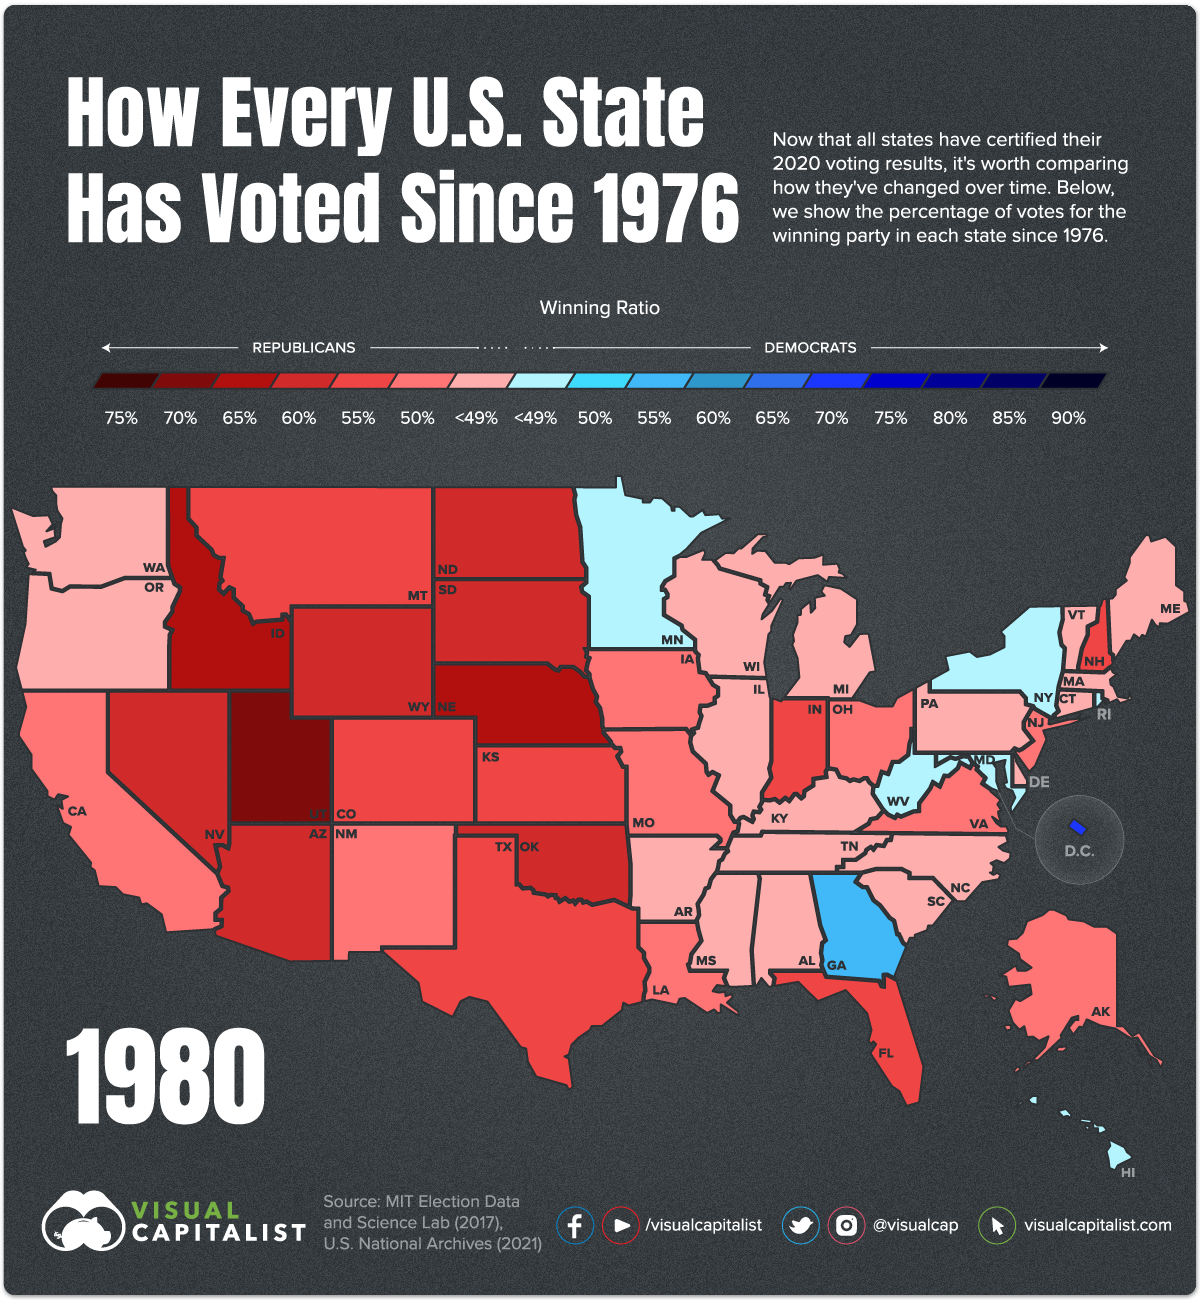
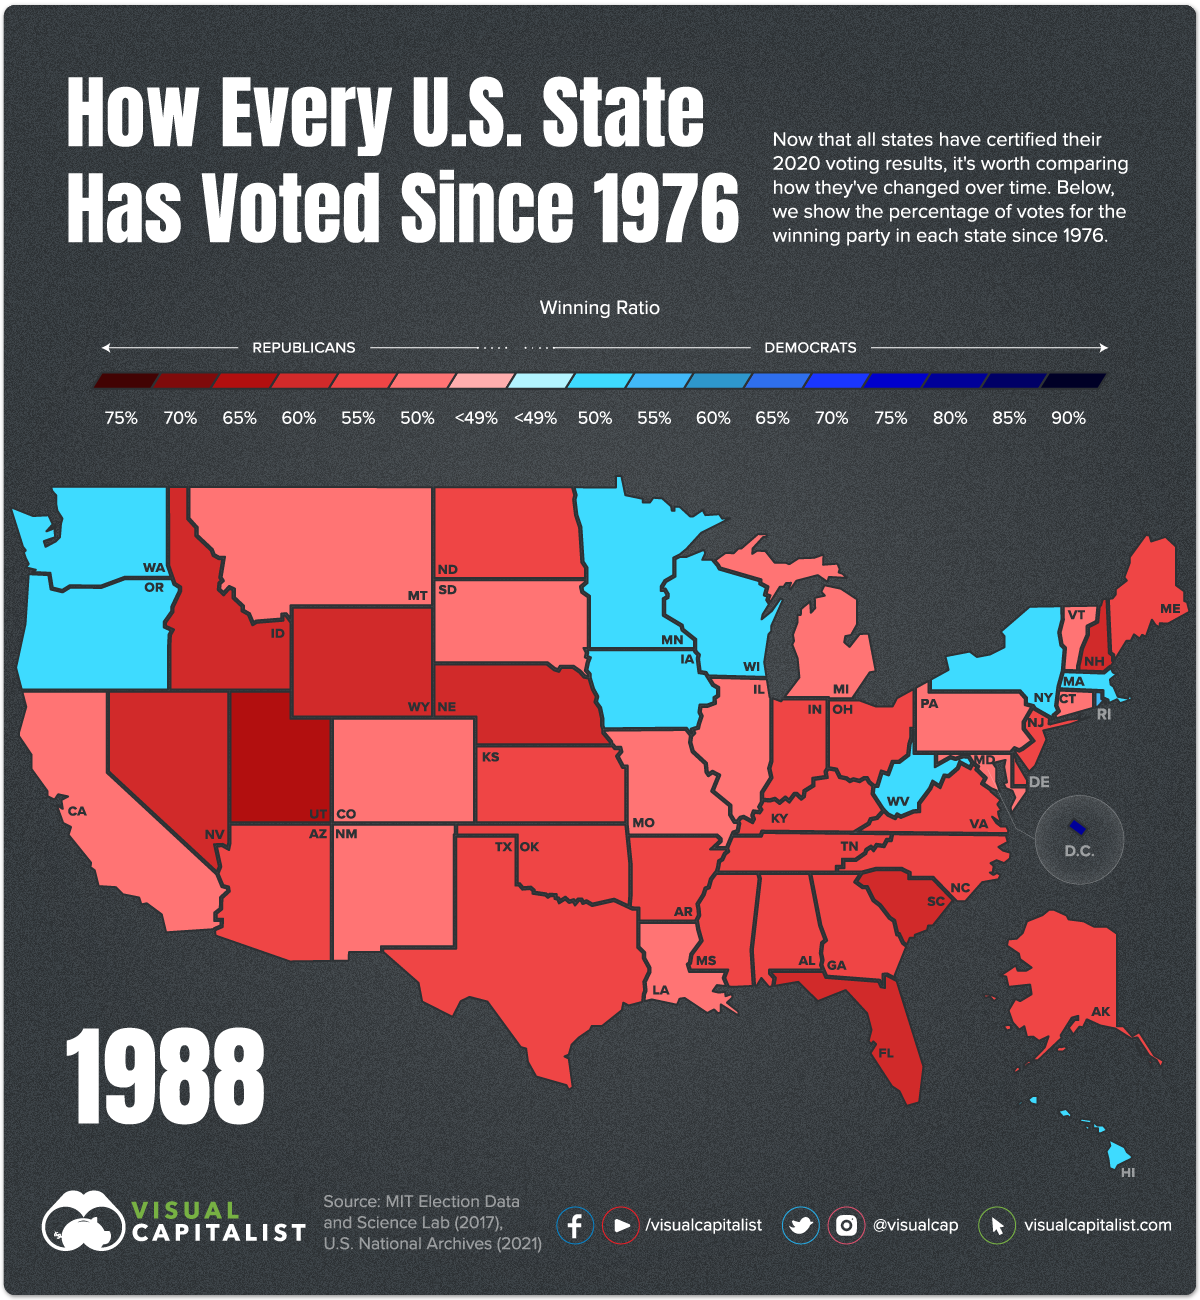
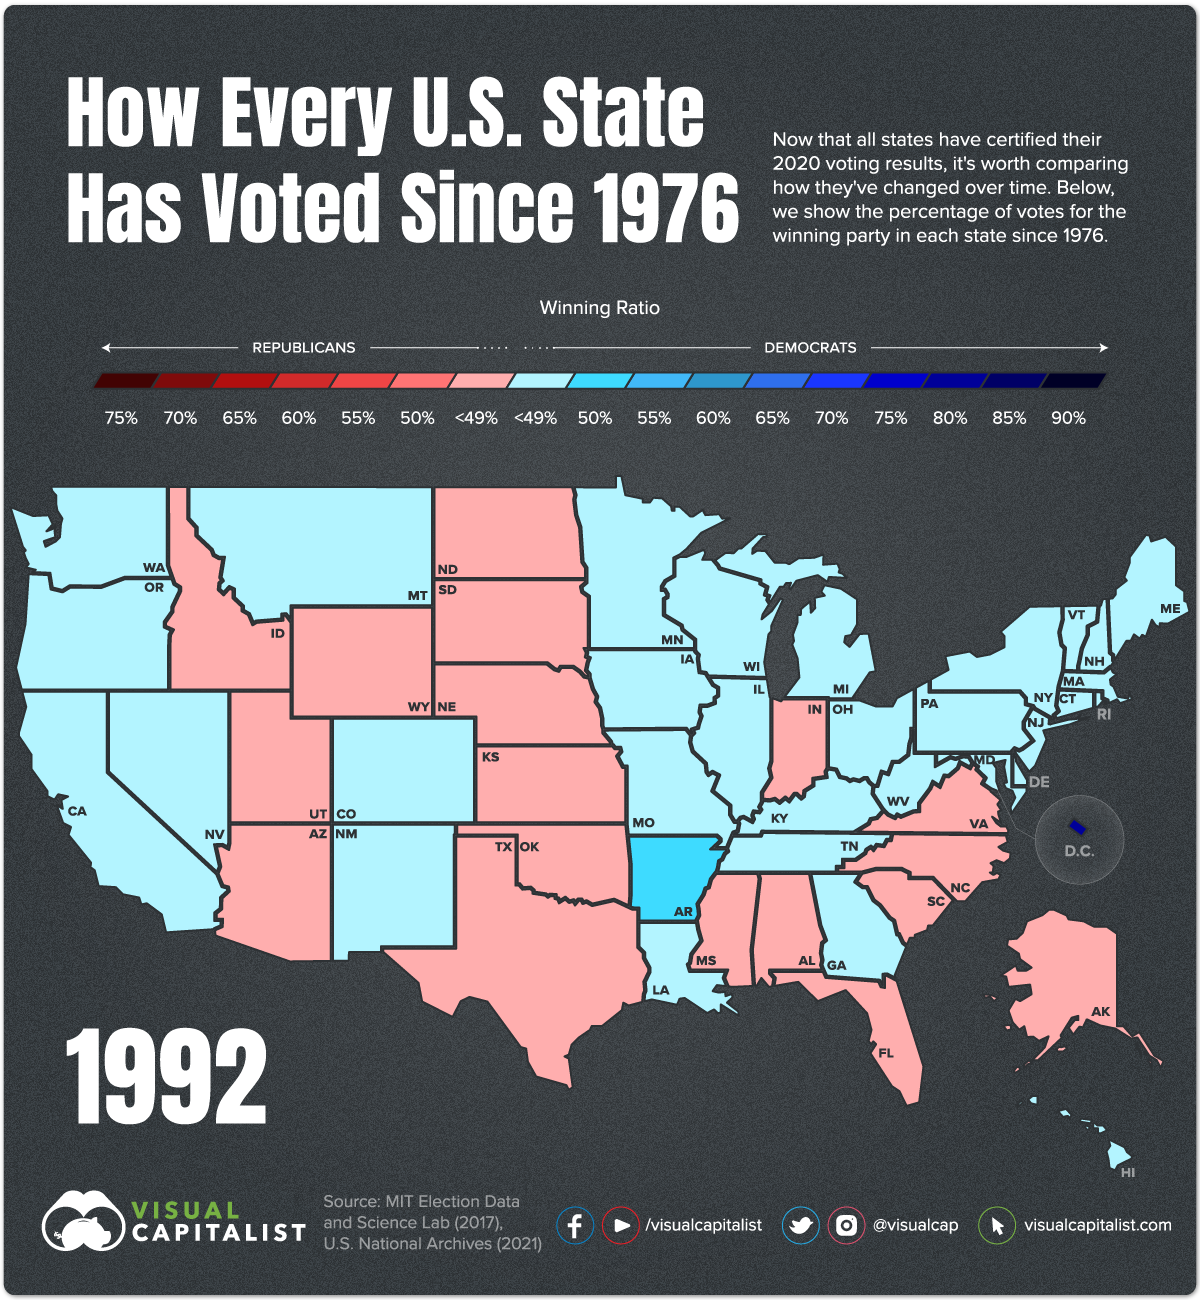
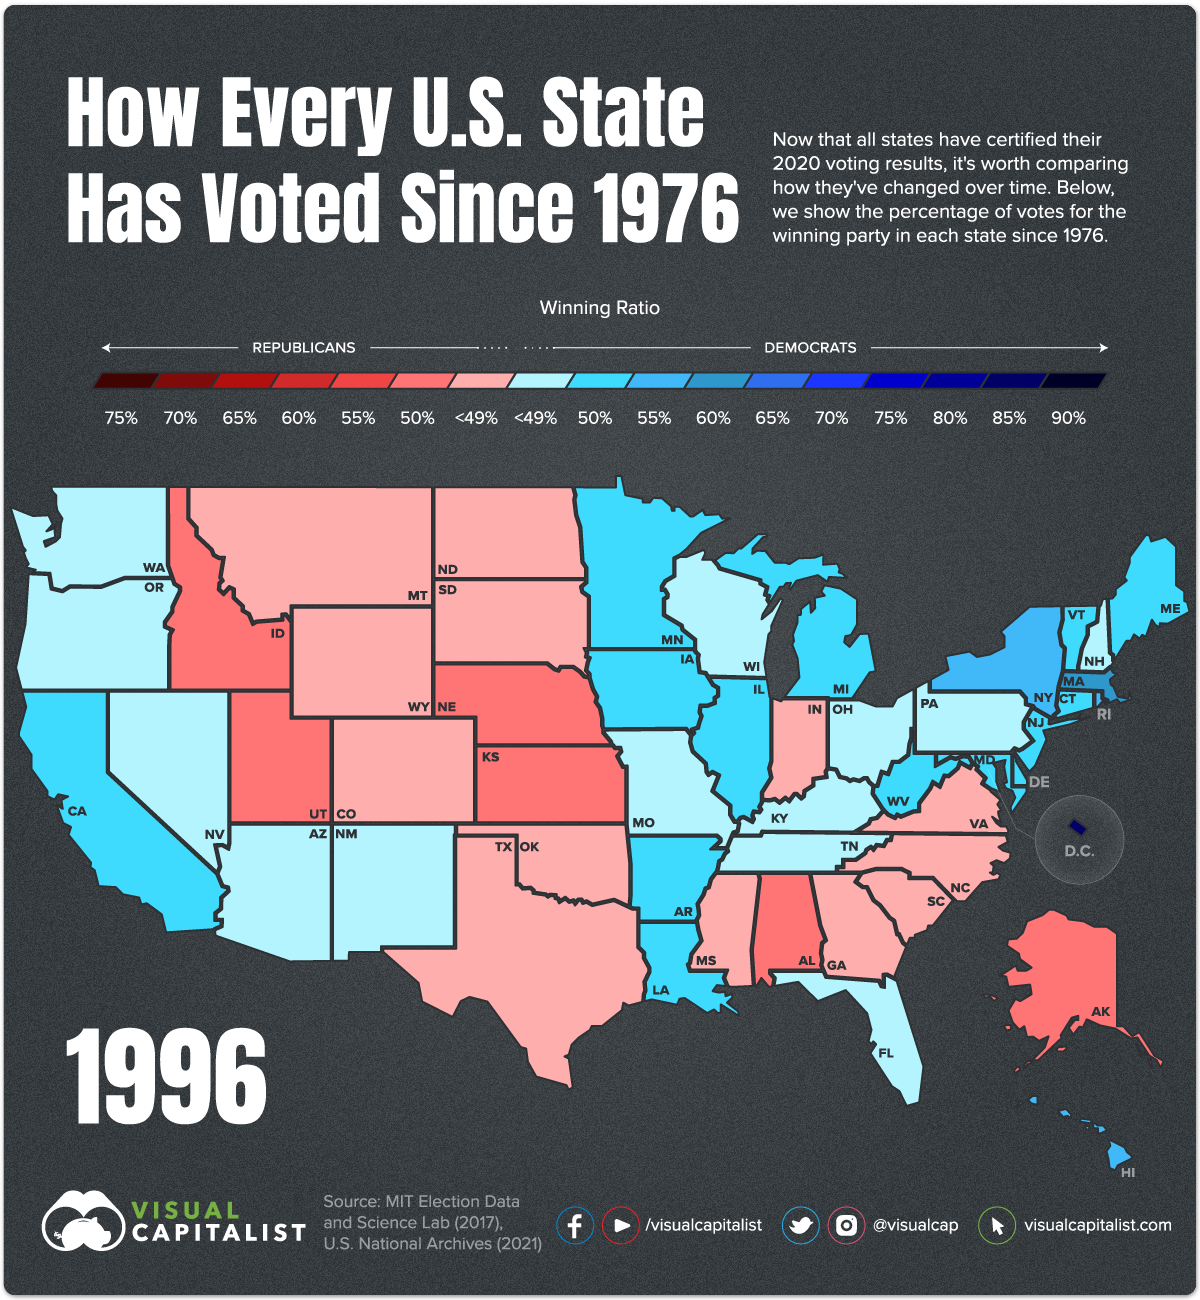
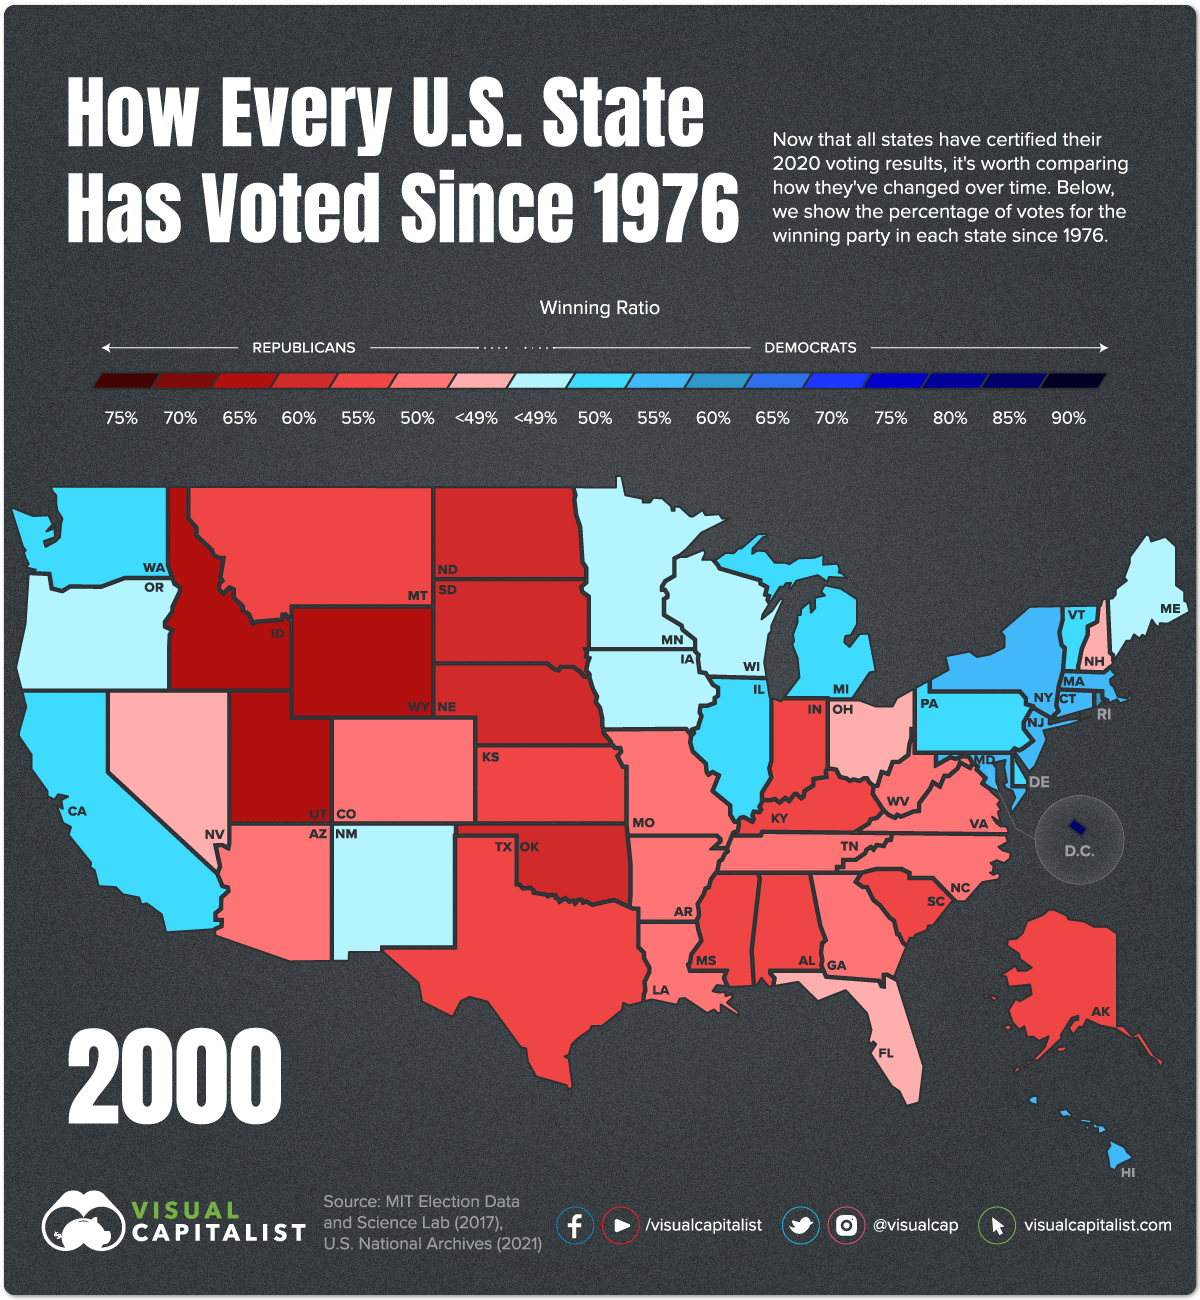
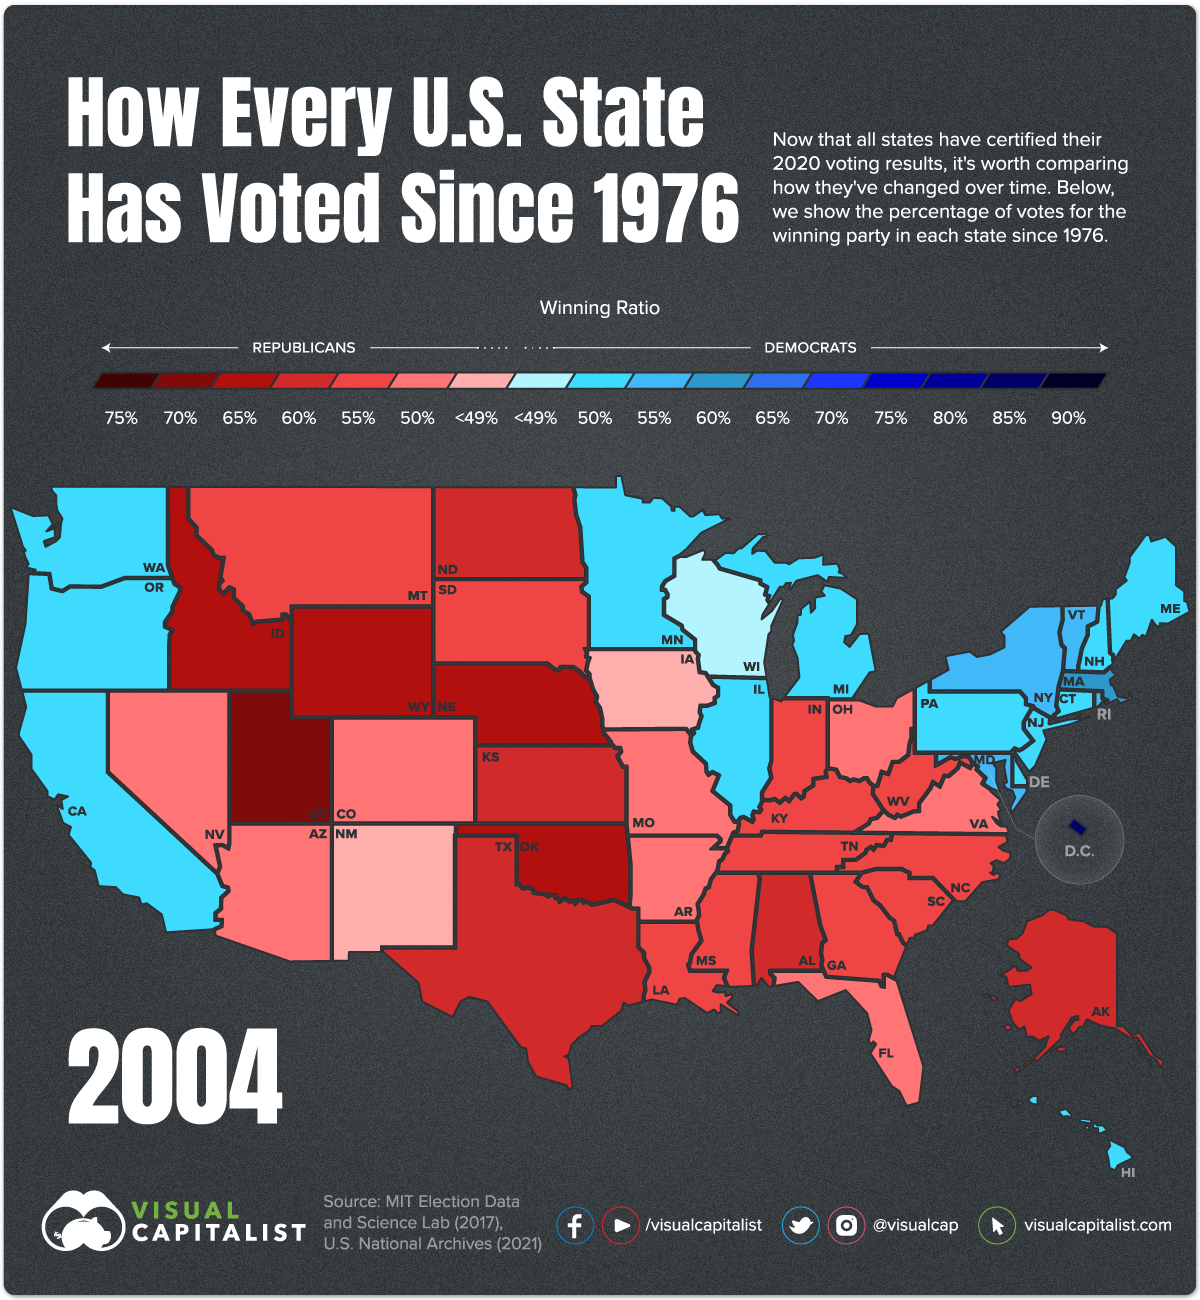
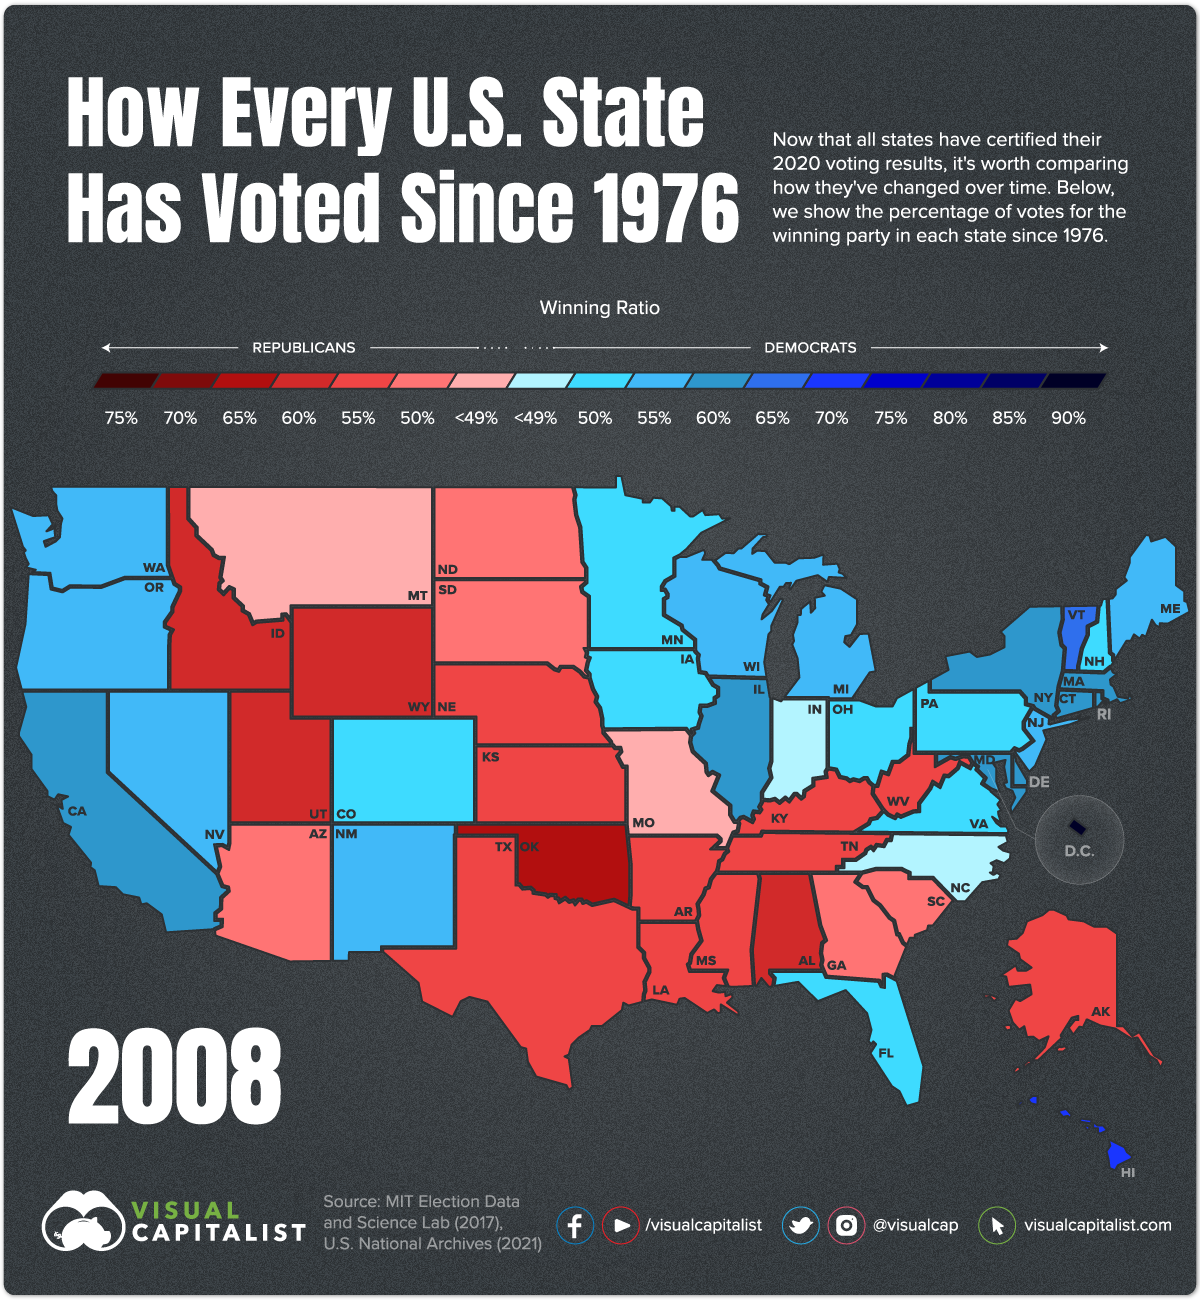
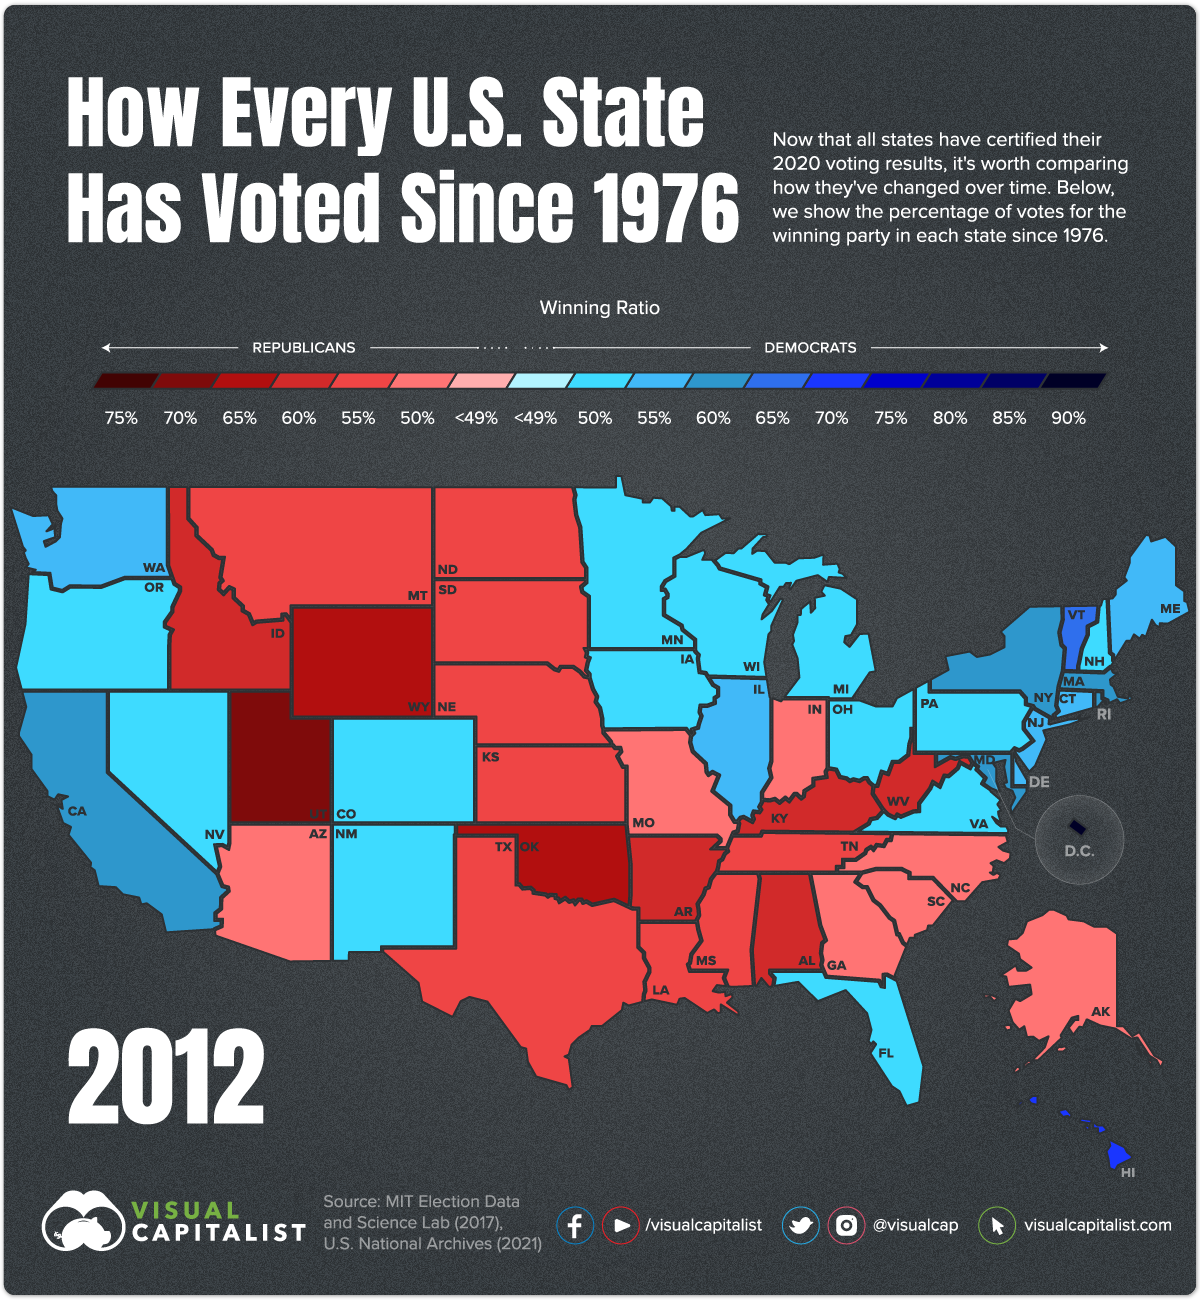
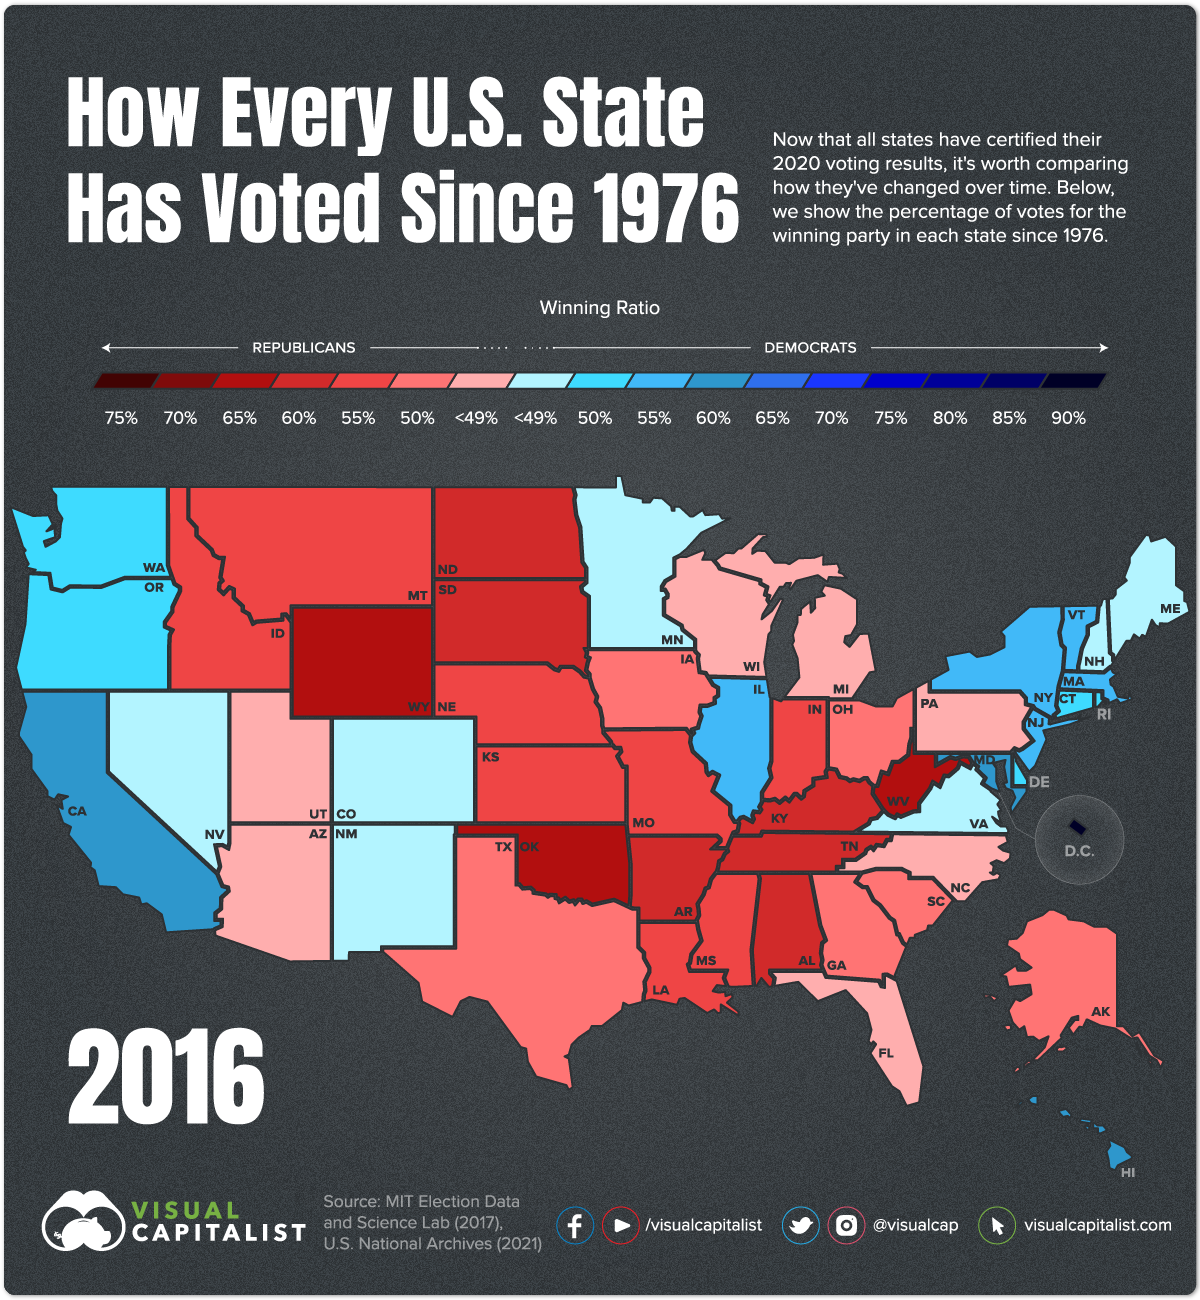
In this graphic, we use data from the U.S. National Archives and the MIT Election Data and Science Lab to show U.S. presidential voting history by state since 1976.
Note: this post has been updated on January 19, 2021 to reflect the latest data.
Each State’s Winning Party
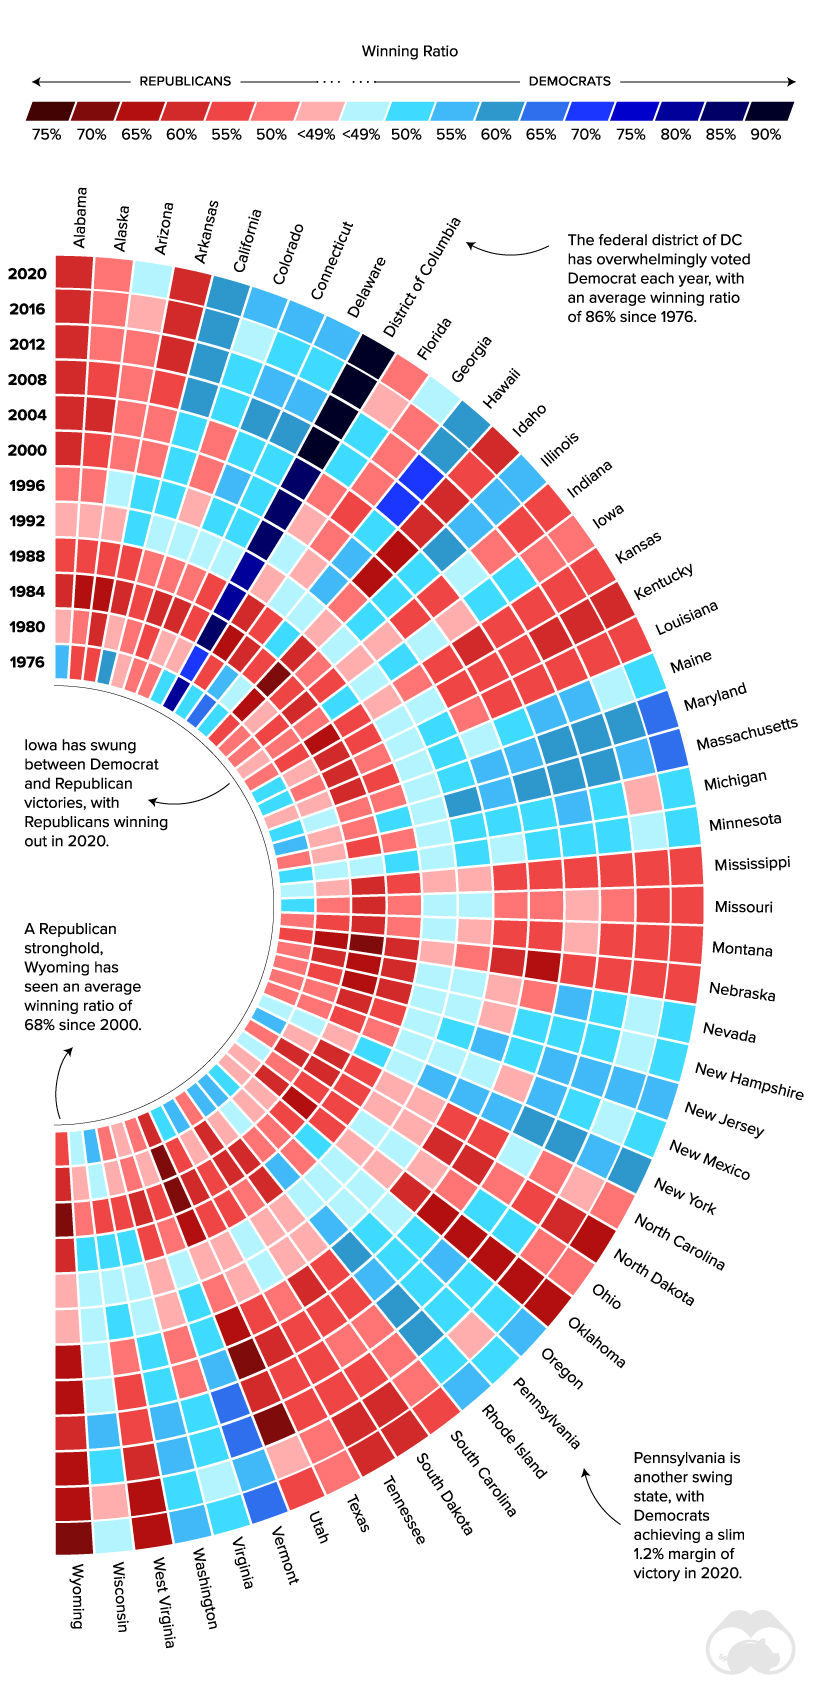
To calculate the winning ratio, we divided the votes for the state’s winning party by the total number of state votes. Here’s another look at the same data, visualized in a different way.
This graphic was inspired by this Reddit post.
As the voting history shows, some states—such as Alaska, Oklahoma, and Wyoming—have consistently supported the Republican Party. On the other hand, Hawaii, Minnesota, and the District of Columbia have been Democrat strongholds for many decades.
The District of Columbia (D.C.) is a federal district, and is not part of any U.S. State. Its population is urban and has a large percentage of Black and college-educated citizens, all of which are groups that tend to identify as Democrat.
Swing states typically see a close contest between Democrats and Republicans. For example, Florida’s average margin of victory for presidential candidates has been just 2.7% since 1996. It’s often seen as a key battleground, and for good reason: the state has 29 electoral college votes, meaning it has a high weighting in the final outcome.
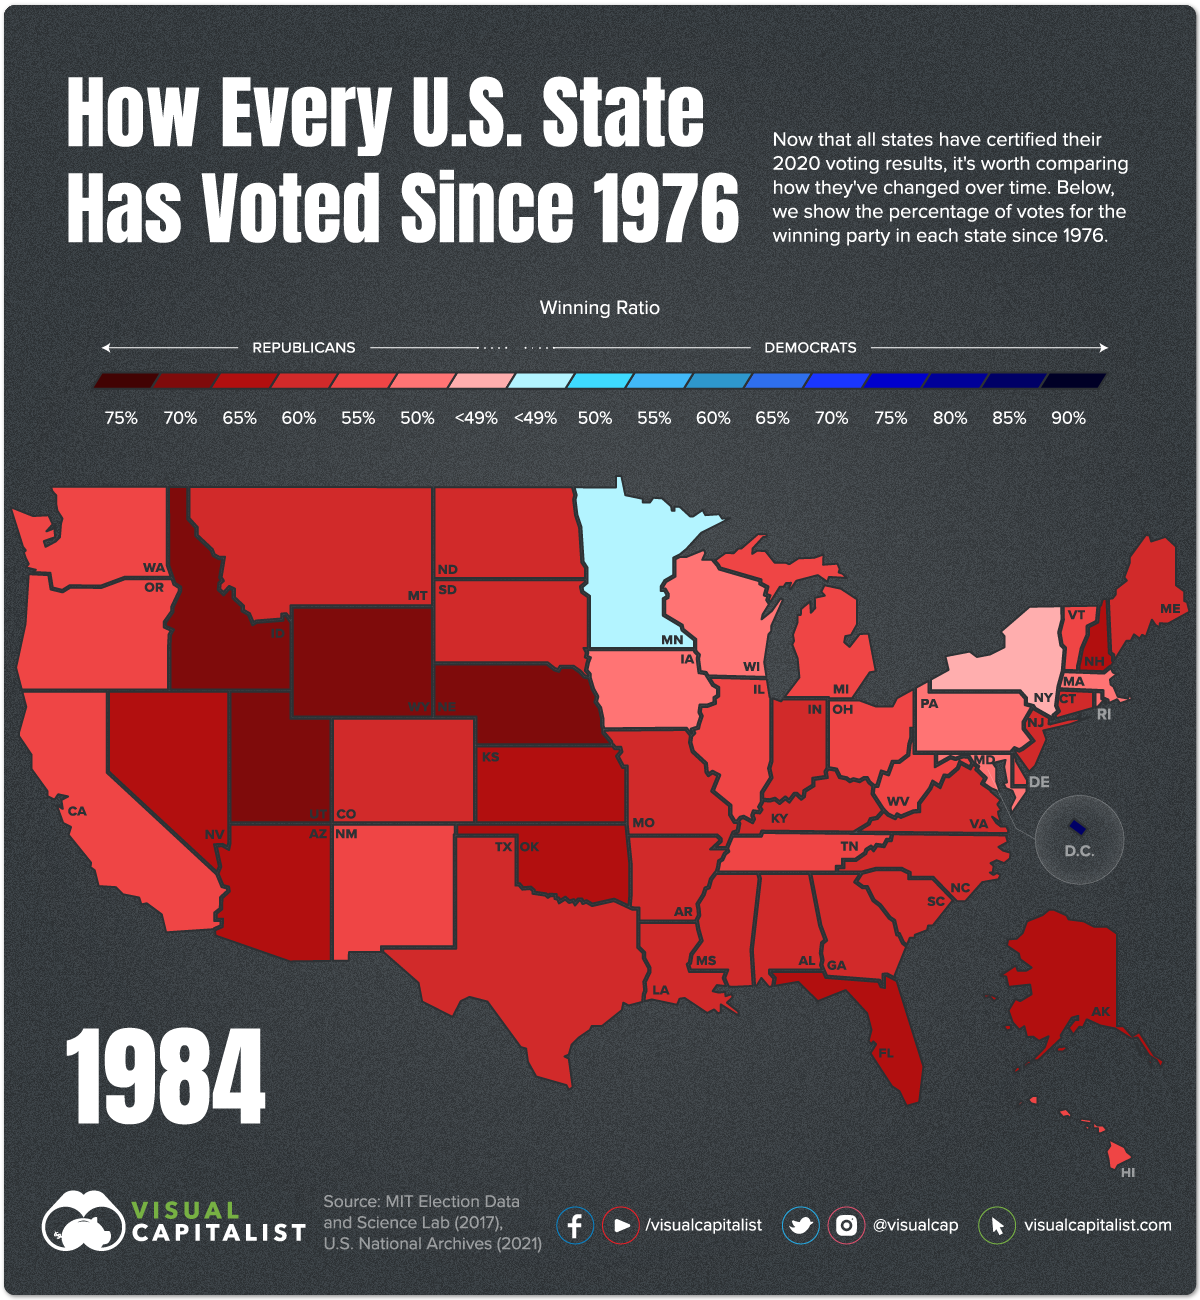
Memorable Election Years
Within U.S. presidential voting history, some election results stand out more than others. In 1984, President Reagan was re-elected in a landslide victory, winning 49 out of 50 states. The remarkable win has been credited to the economic recovery during Reagan’s first term, Reagan’s charisma, and voters’ opposition to the Democrat’s planned tax increases.
In 1992, self-made Texas billionaire Ross Perot ran as a third-party candidate. He captured almost 19% of the popular vote, the highest percentage of any third-party presidential candidate in over 80 years. While he gained support from those looking for a change from traditional party politics, Bill Clinton ultimately went on to win the election.
Most recently, the 2020 election had a record voter turnout, with 66.3% of the eligible population casting a ballot. There was also a record number of mail-in ballots due to the COVID-19 pandemic. This led to widespread allegations of voter fraud, with President Trump and his allies filing 62 lawsuits seeking to overturn election results. In the end, 61 of the lawsuits were defeated and congress confirmed Joe Biden’s victory.
Voting History of Swing States
Both Trump and Biden focused on battleground states in 2020, but where were they successful? Here are nine of the swing states, and their voting history over the last two elections.
| 2020 Winning Ratio | 2020 Margin of Victory | 2016 Winning Ratio | 2016 Margin of Victory | |
|---|---|---|---|---|
| Arizona | 49.4% Democrat | 0.31% | 48.7% Republican | 3.60% |
| Florida | 51.2% Republican | 3.36% | 49.0% Republican | 1.20% |
| Georgia | 49.5% Democrat | 0.24% | 50.8% Republican | 5.20% |
| Iowa | 53.2% Republican | 8.20% | 51.2% Republican | 9.40% |
| Michigan | 50.6% Democrat | 2.78% | 47.5% Republican | 0.20% |
| North Carolina | 50.1% Republican | 1.35% | 49.8% Republican | 3.60% |
| Ohio | 53.3% Republican | 8.03% | 51.7% Republican | 8.10% |
| Pennsylvania | 50.0% Democrat | 1.16% | 48.9% Republican | 0.70% |
| Wisconsin | 49.5% Democrat | 0.63% | 47.2% Republican | 0.70% |
The Republican party won four of the swing states in 2020, including Florida. However, 2020 was the first year since 1964 that the candidate who won Florida did not go on to win the election.
Five of the states—Arizona, Georgia, Michigan, Pennsylvania, and Wisconsin—flipped allegiance to the Democrats. In Georgia, the margin of victory was as small as 0.24% or about 12,000 votes. Ultimately, winning over these states helped lead to a Biden victory.


United States
Charted: What Southeast Asia Thinks About China & the U.S.
A significant share of respondents from an ASEAN-focused survey are not happy about rising American and Chinese influence in the region.
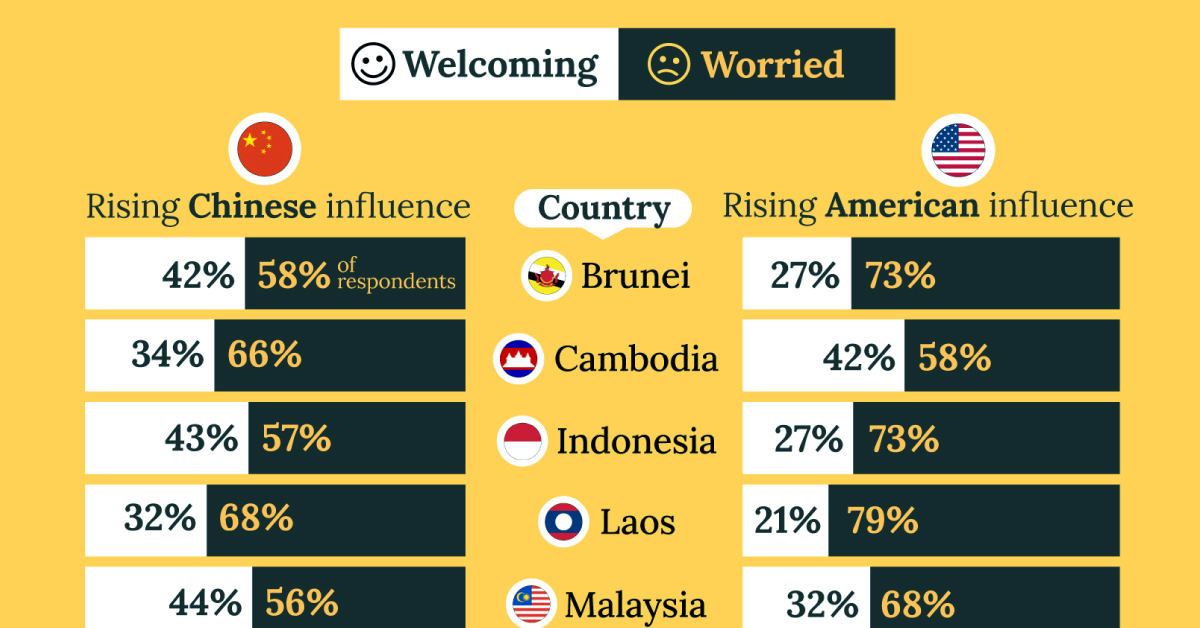
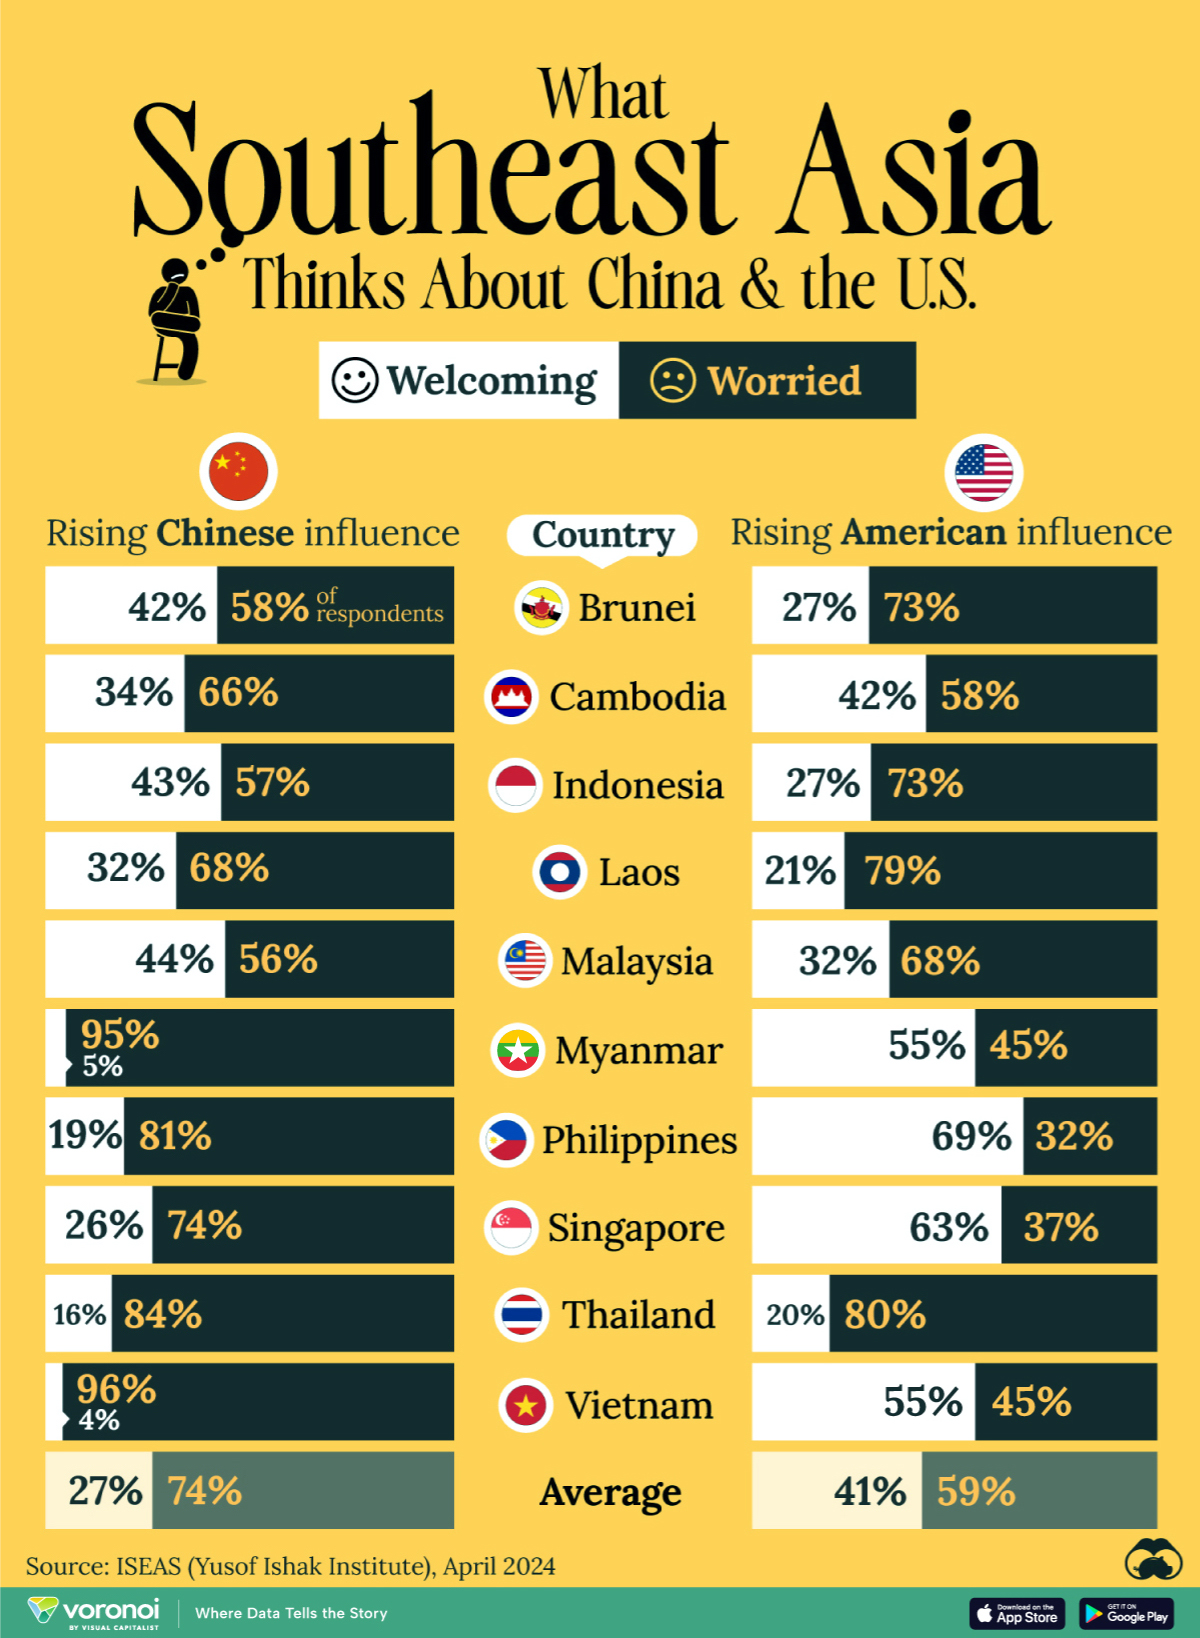
What Southeast Asia Thinks About China & the U.S.
This was originally posted on our Voronoi app. Download the app for free on iOS or Android and discover incredible data-driven charts from a variety of trusted sources.
This chart visualizes the results of a 2024 survey conducted by the ASEAN Studies Centre at the ISEAS-Yusof Ishak Institute. Nearly 2,000 respondents were asked if they were worried or welcoming of rising Chinese and American geopolitical influence in their country.
The countries surveyed all belong to the Association of Southeast Asian Nations (ASEAN), a political and economic union of 10 states in Southeast Asia.
Feelings Towards China
On average, a significant share of respondents from all 10 countries are worried about rising influence from both the U.S. and China.
However, overall skepticism is higher for China, at 74% (versus 59% for U.S.).
| Country | Worried About Growing 🇨🇳 Influence | Welcome Growing 🇨🇳 Influence |
|---|---|---|
| 🇧🇳 Brunei | 58% | 42% |
| 🇰🇭 Cambodia | 66% | 34% |
| 🇮🇩 Indonesia | 57% | 43% |
| 🇱🇦 Laos | 68% | 32% |
| 🇲🇾 Malaysia | 56% | 44% |
| 🇲🇲 Myanmar | 95% | 5% |
| 🇵🇭 Philippines | 81% | 19% |
| 🇸🇬 Singapore | 74% | 26% |
| 🇹🇭 Thailand | 84% | 16% |
| 🇻🇳 Vietnam | 96% | 4% |
| Average | 74% | 27% |
The recently-cooled but still active territorial concerns over the South China Sea may play a significant role in these responses, especially in countries which are also claimants over the sea.
For example, in Vietnam over 95% of respondents said they were worried about China’s growing influence.
Feelings Towards America
Conversely, rising American influence is welcomed in two countries with competing claims in the South China Sea, the Philippines (69%) and Vietnam (55%).
| Country | Worried About Growing 🇺🇸 Influence | Welcome Growing 🇺🇸 Influence |
|---|---|---|
| 🇧🇳 Brunei | 73% | 27% |
| 🇰🇭 Cambodia | 58% | 42% |
| 🇮🇩 Indonesia | 73% | 27% |
| 🇱🇦 Laos | 79% | 21% |
| 🇲🇾 Malaysia | 68% | 32% |
| 🇲🇲 Myanmar | 45% | 55% |
| 🇵🇭 Philippines | 32% | 69% |
| 🇸🇬 Singapore | 37% | 63% |
| 🇹🇭 Thailand | 80% | 20% |
| 🇻🇳 Vietnam | 45% | 55% |
| Average | 59% | 41% |
Despite this, on a regional average, more respondents worry about growing American influence (59%) than they welcome it (41%).
Interestingly, it seems almost every ASEAN nation has a clear preference for one superpower over the other.
The only exception is Thailand, where those surveyed were not a fan of either option, with 84% worried about China, and 80% worried about the U.S.

-

 Best of6 days ago
Best Visualizations of April on the Voronoi App
-

 Brands2 weeks ago
How Tech Logos Have Evolved Over Time
-

 Energy2 weeks ago
Ranked: The Top 10 EV Battery Manufacturers in 2023
-

 Demographics2 weeks ago
Countries With the Largest Happiness Gains Since 2010
-

 VC+2 weeks ago
VC+: Get Our Key Takeaways From the IMF’s World Economic Outlook
-

 Demographics2 weeks ago
The Countries That Have Become Sadder Since 2010
-

 Money2 weeks ago
Charted: Who Has Savings in This Economy?
-

 Technology1 week ago
Visualizing AI Patents by Country