Technology
The Top 10 Millennial Brands [Charts]
![The Top 10 Millennial Brands [Charts]](https://www.visualcapitalist.com/wp-content/uploads/2016/03/millennial-brand-survey-chart.png)
The Top 10 Millennial Brands [Charts]
Tech continues to ascend the ranks, displacing traditional retail brands
The Chart of the Week is a weekly Visual Capitalist feature on Fridays.
The market for U.S. millennials is expected to blossom to $1.4 trillion by 2020, according to international consulting firm Accenture. While this generation of digital natives is already a primary marketing target today, in the upcoming years millennials will make up a hefty 30% of all retail spending in the country.
However, millennials are complex and notoriously difficult to read, even for professional marketers. With values that seem to contradict one another, it’s a challenge for companies to successfully gain market share with this audience.
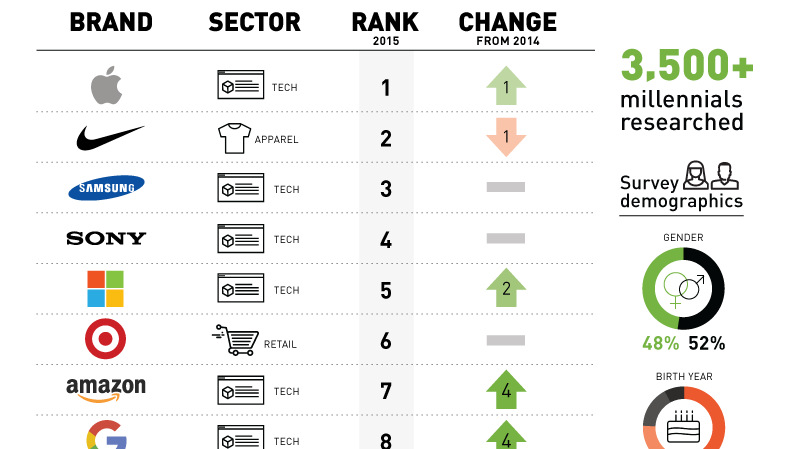
As millennials mature, researchers are gaining ground on the needs and wants of this generation. This week’s Chart of the Week shares data from a comprehensive survey of 3,500 millennials that were asked, without any prompt, about their favorite brands over the past three years. The results, which can be found in deeper depth here, help give us some insight as to what millennials look for in a brand.
Tech Brand Disparity
It’s likely that no one will be surprised to learn that tech brands are among the best polling for millennials.
Apple claimed the top spot in the shortlist of the Top 10 millennial brands, while Samsung, Microsoft, Sony, Amazon, and Google all helped to round out the group.
That said, what did surprise is the lack of showing by other prominent technology brands. Facebook, a company that reaches more than a billion people every day, came in at an extremely disappointing 65th place. That’s behind companies such as LG (20), Dell (28), HP (36), HTC (48), ASUS (52) and eBay (53). It’s even behind dreaded telecom companies like Verizon (61) and AT&T (62).
Meanwhile, Twitter, IBM, Intel, Paypal, and LinkedIn didn’t even register on the Top 100 radar.
Why are some tech brands rocketing up the rankings, while others are falling flat?
Some, but not others?
According to Moosylvania, the researchers behind the survey, there was a major commonality between the top brands for millennials.
They found that millennial cohorts prefer fun and entertaining content to news and information in their social media feeds by a margin of six-to-one. Norty Cohen, CEO of Moosylvania, elaborated on this:
Entertainment provides a natural opportunity for a brand to connect as shareable content. These cohorts are marketing themselves, and when a brand doesn’t take itself too seriously but instead provides fun that can be shared, it works.
Could Facebook be the destroyer of fun, by monetizing people’s news feeds? Are IBM and LinkedIn too “businessy” to poke fun at themselves? Perhaps Paypal is too financial – a damning trait, since not a single Top 100 brand was a bank or financial institution.
This may explain why a higher degree of millennials are happy to leave traditional and boring financial institutions in the dust. In a previous chart, we showed 49% of millennials are much more open to engaging tech companies for financial services, while only 16% of people of other generations feel the same. It may also be a problem that rising fintech companies such as Venmo, Lending Club, Nutmeg, and others can solve.


Technology
Visualizing AI Patents by Country
See which countries have been granted the most AI patents each year, from 2012 to 2022.


Visualizing AI Patents by Country
This was originally posted on our Voronoi app. Download the app for free on iOS or Android and discover incredible data-driven charts from a variety of trusted sources.
This infographic shows the number of AI-related patents granted each year from 2010 to 2022 (latest data available). These figures come from the Center for Security and Emerging Technology (CSET), accessed via Stanford University’s 2024 AI Index Report.
From this data, we can see that China first overtook the U.S. in 2013. Since then, the country has seen enormous growth in the number of AI patents granted each year.
| Year | China | EU and UK | U.S. | RoW | Global Total |
|---|---|---|---|---|---|
| 2010 | 307 | 137 | 984 | 571 | 1,999 |
| 2011 | 516 | 129 | 980 | 581 | 2,206 |
| 2012 | 926 | 112 | 950 | 660 | 2,648 |
| 2013 | 1,035 | 91 | 970 | 627 | 2,723 |
| 2014 | 1,278 | 97 | 1,078 | 667 | 3,120 |
| 2015 | 1,721 | 110 | 1,135 | 539 | 3,505 |
| 2016 | 1,621 | 128 | 1,298 | 714 | 3,761 |
| 2017 | 2,428 | 144 | 1,489 | 1,075 | 5,136 |
| 2018 | 4,741 | 155 | 1,674 | 1,574 | 8,144 |
| 2019 | 9,530 | 322 | 3,211 | 2,720 | 15,783 |
| 2020 | 13,071 | 406 | 5,441 | 4,455 | 23,373 |
| 2021 | 21,907 | 623 | 8,219 | 7,519 | 38,268 |
| 2022 | 35,315 | 1,173 | 12,077 | 13,699 | 62,264 |
In 2022, China was granted more patents than every other country combined.
While this suggests that the country is very active in researching the field of artificial intelligence, it doesn’t necessarily mean that China is the farthest in terms of capability.
Key Facts About AI Patents
According to CSET, AI patents relate to mathematical relationships and algorithms, which are considered abstract ideas under patent law. They can also have different meaning, depending on where they are filed.
In the U.S., AI patenting is concentrated amongst large companies including IBM, Microsoft, and Google. On the other hand, AI patenting in China is more distributed across government organizations, universities, and tech firms (e.g. Tencent).
In terms of focus area, China’s patents are typically related to computer vision, a field of AI that enables computers and systems to interpret visual data and inputs. Meanwhile America’s efforts are more evenly distributed across research fields.
Learn More About AI From Visual Capitalist
If you want to see more data visualizations on artificial intelligence, check out this graphic that shows which job departments will be impacted by AI the most.

-

 Mining1 week ago
Gold vs. S&P 500: Which Has Grown More Over Five Years?
-

 Markets2 weeks ago
Ranked: The Most Valuable Housing Markets in America
-

 Money2 weeks ago
Which States Have the Highest Minimum Wage in America?
-

 AI2 weeks ago
Ranked: Semiconductor Companies by Industry Revenue Share
-

 Markets2 weeks ago
Ranked: The World’s Top Flight Routes, by Revenue
-

 Countries2 weeks ago
Population Projections: The World’s 6 Largest Countries in 2075
-

 Markets2 weeks ago
The Top 10 States by Real GDP Growth in 2023
-

 Demographics2 weeks ago
The Smallest Gender Wage Gaps in OECD Countries