Markets
Millennials on Investing, Debt, and Banking [Chart]
![Millennials on Investing, Debt, and Banking [Chart]](https://www.visualcapitalist.com/wp-content/uploads/2015/11/millennials-investing-debt-chart.jpg)
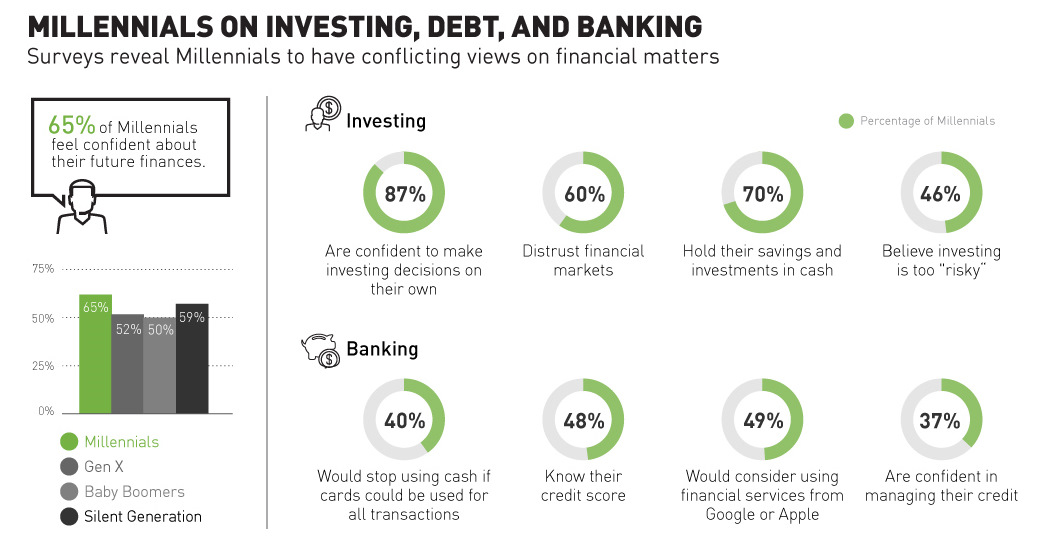
Millennials on Investing, Debt, and Banking [Chart]
Surveys reveal Millennials to have conflicting views on financial matters.
The Chart of the Week is a weekly Visual Capitalist feature on Fridays.
Millennials are the most confident generation regarding their financial future. In fact, recent survey results show that 65% of Millennials feel confident about their future finances, compared to 52% of Gen X, 50% of Baby Boomers, and 59% of the Silent Generation. This is not a surprising find, as one of the defining traits of the Millennial group is high self-confidence.
The problem is that this confidence seems to conflict with other survey findings.
In reality, it looks like many Millennials could still have a steep learning curve ahead of them in the financial realm.
Debt
The first red flag is with debt. Only 48% of Millennials know their credit score, and just 37% are confident in their ability to manage their credit.
Millennial student debt is at sky-high levels, and many are struggling to pay. Even the Federal Reserve noted that the delinquency rate for student loans in repayment is a staggering 27% in the United States.
Investing
Another potential concern arises with the generation’s attitudes towards investing and building wealth. Despite their confidence in their financial future, 46% of Millennials think investing is “risky”, 60% distrust financial markets, and a whopping 70% hold their savings and investments in cash.
While there are some reasoning for these numbers individually, as a whole they seem to paint a broader picture that Millennials are afraid of entering the market in any capacity. As a result, it would appear that they hold onto their money in cash while interest rates are at their lowest in human history.
Historically, the middle class has built much of their wealth through investing. While it is true that Millennials witnessed the failures of Wall Street first-hand during the Financial Crisis, it doesn’t change the fact that investing will likely play a key role in building their financial futures. Millennials do not have to only own stocks either, as there are plenty of market instruments, hedging strategies, and stores of value out there that can protect against market downside at any risk tolerance.
Further, 87% of Millennials feel empowered to make investing decisions on their own. While we would agree that investing for yourself can be one of the most rewarding ways to build a strong financial future, not everyone can be an expert in personal finance. That’s why people hire brokers or investment advisors.
When it comes to opinions on these types of professionals, Millennials have contradicting feelings. For example: 58% of Millennials are interested in robo-advisors, yet at the same time 64% say that a personal relationship with an advisor is important.
Cash and Banking
Millennials also have unorthodox views on cash and banking. As a generation of people that grew up in the digital age, 40% of Millennials would stop using cash altogether if cards could be used for all transactions.
Further, 49% would consider using financial services from tech companies like Google or Facebook. In contrast, only 16% of people in older generations would consider a similar move.
This disparity is part of the reason why bank executives today are unaware of the very technology startups gaining traction in the market, and that seek to unseat them.


Markets
The European Stock Market: Attractive Valuations Offer Opportunities
On average, the European stock market has valuations that are nearly 50% lower than U.S. valuations. But how can you access the market?


European Stock Market: Attractive Valuations Offer Opportunities
Europe is known for some established brands, from L’Oréal to Louis Vuitton. However, the European stock market offers additional opportunities that may be lesser known.
The above infographic, sponsored by STOXX, outlines why investors may want to consider European stocks.
Attractive Valuations
Compared to most North American and Asian markets, European stocks offer lower or comparable valuations.
| Index | Price-to-Earnings Ratio | Price-to-Book Ratio |
|---|---|---|
| EURO STOXX 50 | 14.9 | 2.2 |
| STOXX Europe 600 | 14.4 | 2 |
| U.S. | 25.9 | 4.7 |
| Canada | 16.1 | 1.8 |
| Japan | 15.4 | 1.6 |
| Asia Pacific ex. China | 17.1 | 1.8 |
Data as of February 29, 2024. See graphic for full index names. Ratios based on trailing 12 month financials. The price to earnings ratio excludes companies with negative earnings.
On average, European valuations are nearly 50% lower than U.S. valuations, potentially offering an affordable entry point for investors.
Research also shows that lower price ratios have historically led to higher long-term returns.
Market Movements Not Closely Connected
Over the last decade, the European stock market had low-to-moderate correlation with North American and Asian equities.
The below chart shows correlations from February 2014 to February 2024. A value closer to zero indicates low correlation, while a value of one would indicate that two regions are moving in perfect unison.
| EURO STOXX 50 | STOXX EUROPE 600 | U.S. | Canada | Japan | Asia Pacific ex. China |
|
|---|---|---|---|---|---|---|
| EURO STOXX 50 | 1.00 | 0.97 | 0.55 | 0.67 | 0.24 | 0.43 |
| STOXX EUROPE 600 | 1.00 | 0.56 | 0.71 | 0.28 | 0.48 | |
| U.S. | 1.00 | 0.73 | 0.12 | 0.25 | ||
| Canada | 1.00 | 0.22 | 0.40 | |||
| Japan | 1.00 | 0.88 | ||||
| Asia Pacific ex. China | 1.00 |
Data is based on daily USD returns.
European equities had relatively independent market movements from North American and Asian markets. One contributing factor could be the differing sector weights in each market. For instance, technology makes up a quarter of the U.S. market, but health care and industrials dominate the broader European market.
Ultimately, European equities can enhance portfolio diversification and have the potential to mitigate risk for investors.
Tracking the Market
For investors interested in European equities, STOXX offers a variety of flagship indices:
| Index | Description | Market Cap |
|---|---|---|
| STOXX Europe 600 | Pan-regional, broad market | €10.5T |
| STOXX Developed Europe | Pan-regional, broad-market | €9.9T |
| STOXX Europe 600 ESG-X | Pan-regional, broad market, sustainability focus | €9.7T |
| STOXX Europe 50 | Pan-regional, blue-chip | €5.1T |
| EURO STOXX 50 | Eurozone, blue-chip | €3.5T |
Data is as of February 29, 2024. Market cap is free float, which represents the shares that are readily available for public trading on stock exchanges.
The EURO STOXX 50 tracks the Eurozone’s biggest and most traded companies. It also underlies one of the world’s largest ranges of ETFs and mutual funds. As of November 2023, there were €27.3 billion in ETFs and €23.5B in mutual fund assets under management tracking the index.
“For the past 25 years, the EURO STOXX 50 has served as an accurate, reliable and tradable representation of the Eurozone equity market.”
— Axel Lomholt, General Manager at STOXX
Partnering with STOXX to Track the European Stock Market
Are you interested in European equities? STOXX can be a valuable partner:
- Comprehensive, liquid and investable ecosystem
- European heritage, global reach
- Highly sophisticated customization capabilities
- Open architecture approach to using data
- Close partnerships with clients
- Part of ISS STOXX and Deutsche Börse Group
With a full suite of indices, STOXX can help you benchmark against the European stock market.
Learn how STOXX’s European indices offer liquid and effective market access.

-

 Economy2 days ago
Economic Growth Forecasts for G7 and BRICS Countries in 2024
The IMF has released its economic growth forecasts for 2024. How do the G7 and BRICS countries compare?
-

 Markets1 week ago
U.S. Debt Interest Payments Reach $1 Trillion
U.S. debt interest payments have surged past the $1 trillion dollar mark, amid high interest rates and an ever-expanding debt burden.
-

 United States2 weeks ago
Ranked: The Largest U.S. Corporations by Number of Employees
We visualized the top U.S. companies by employees, revealing the massive scale of retailers like Walmart, Target, and Home Depot.
-

 Markets2 weeks ago
The Top 10 States by Real GDP Growth in 2023
This graphic shows the states with the highest real GDP growth rate in 2023, largely propelled by the oil and gas boom.
-

 Markets2 weeks ago
Ranked: The World’s Top Flight Routes, by Revenue
In this graphic, we show the highest earning flight routes globally as air travel continued to rebound in 2023.
-

 Markets2 weeks ago
Ranked: The Most Valuable Housing Markets in America
The U.S. residential real estate market is worth a staggering $47.5 trillion. Here are the most valuable housing markets in the country.

-

 Energy1 week ago
The World’s Biggest Nuclear Energy Producers
-

 Money2 weeks ago
Which States Have the Highest Minimum Wage in America?
-

 Technology2 weeks ago
Ranked: Semiconductor Companies by Industry Revenue Share
-
Markets2 weeks ago
Ranked: The World’s Top Flight Routes, by Revenue
-

 Countries2 weeks ago
Population Projections: The World’s 6 Largest Countries in 2075
-
Markets2 weeks ago
The Top 10 States by Real GDP Growth in 2023
-

 Demographics2 weeks ago
The Smallest Gender Wage Gaps in OECD Countries
-

 United States2 weeks ago
Where U.S. Inflation Hit the Hardest in March 2024