Politics
This is How Much NATO Countries Spend on Defense


This Is How Much NATO Countries Spend on Defense
The North Atlantic Treaty Organization (NATO) exists for the sole purpose of facilitating a political and military alliance between almost 30 countries. All are obligated to one another in times of war, but some countries have much stronger militaries and defense systems than others.
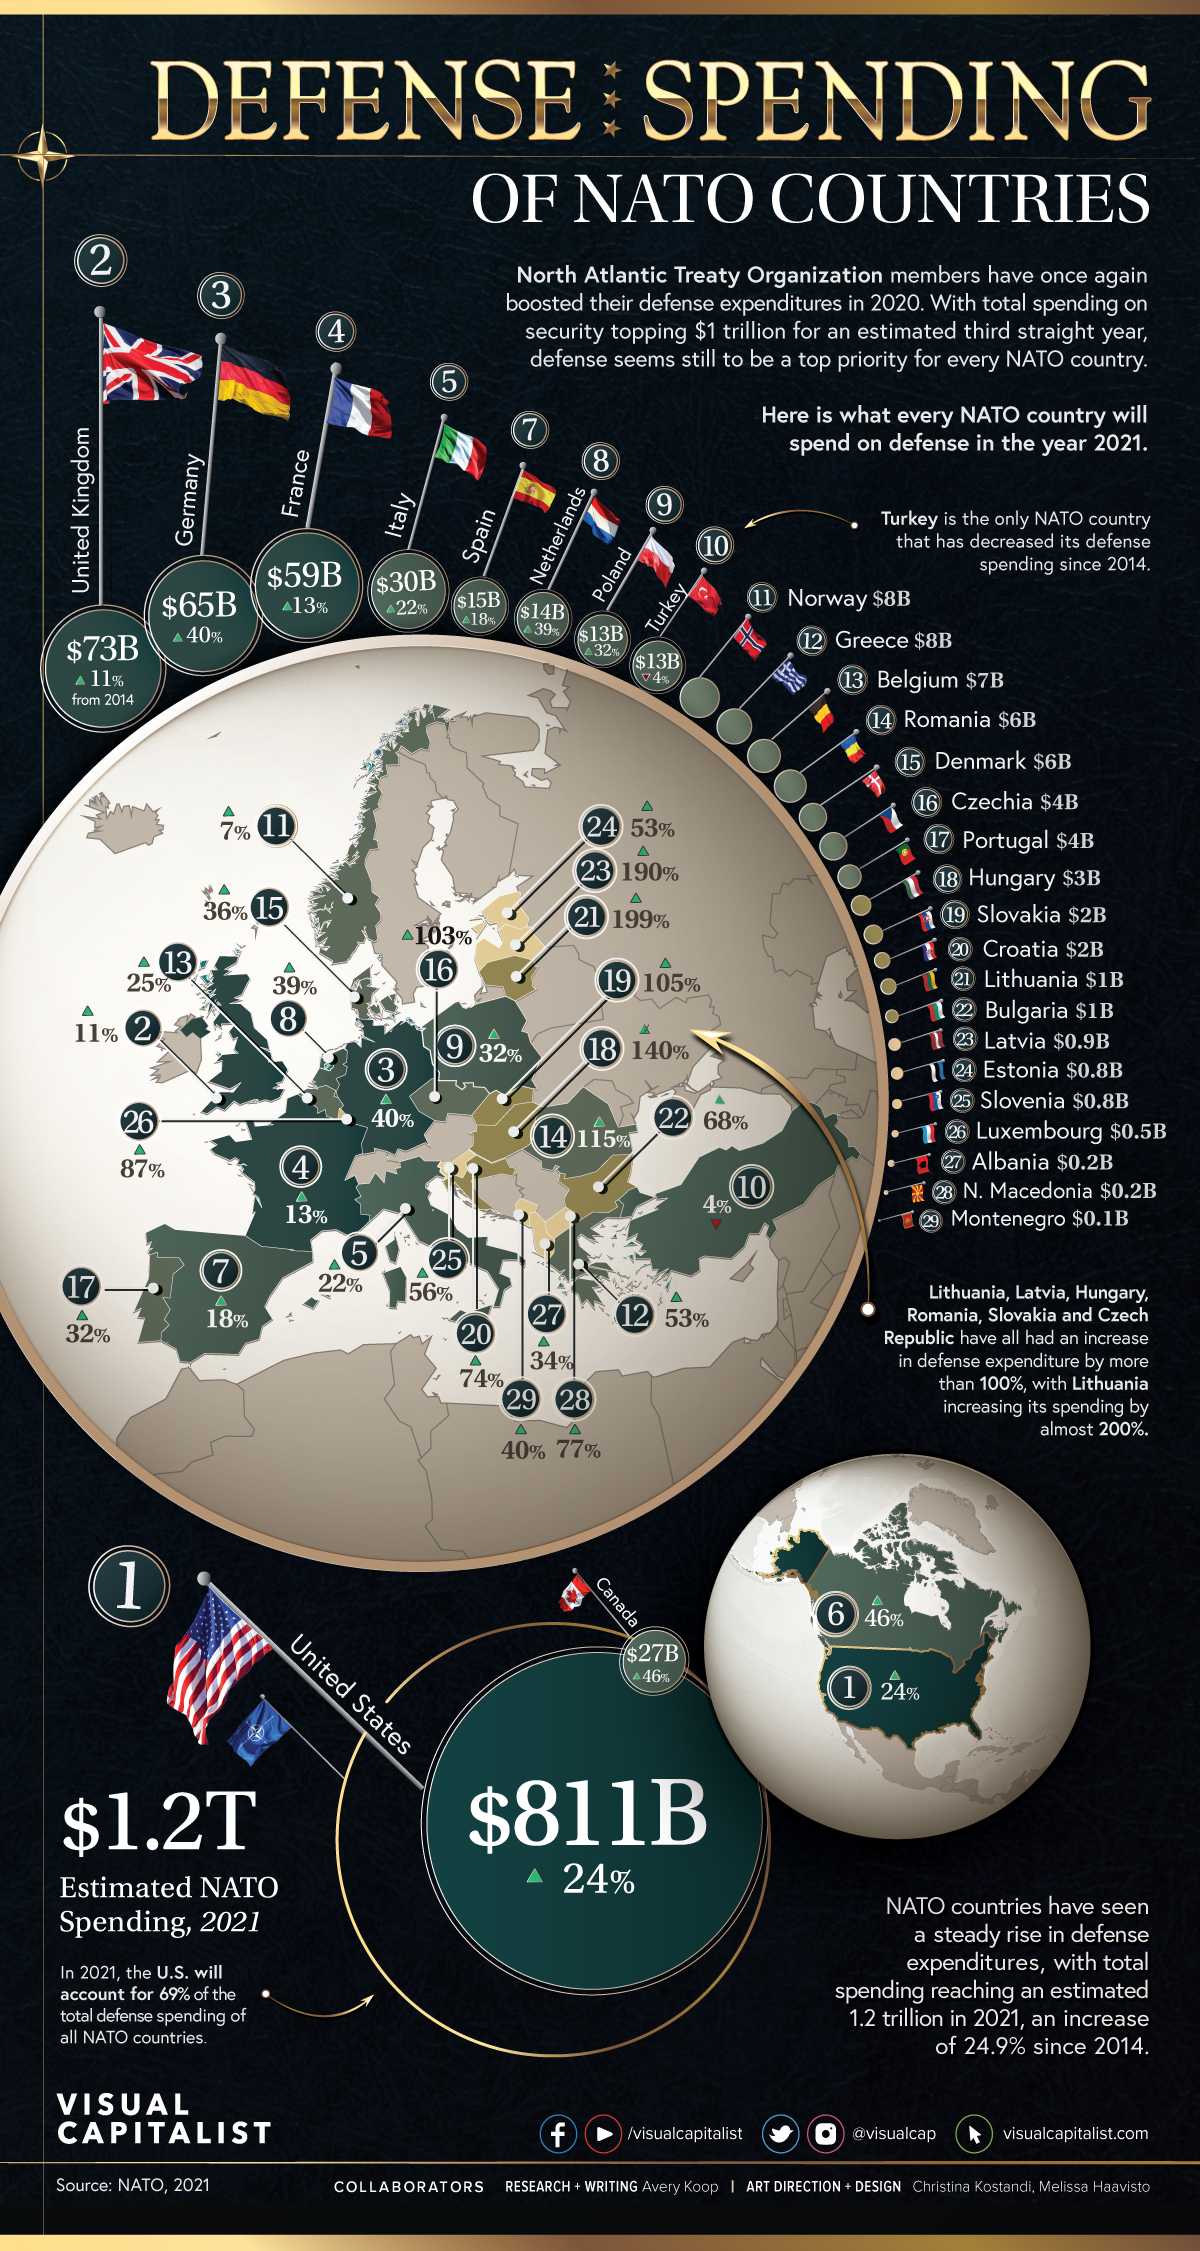
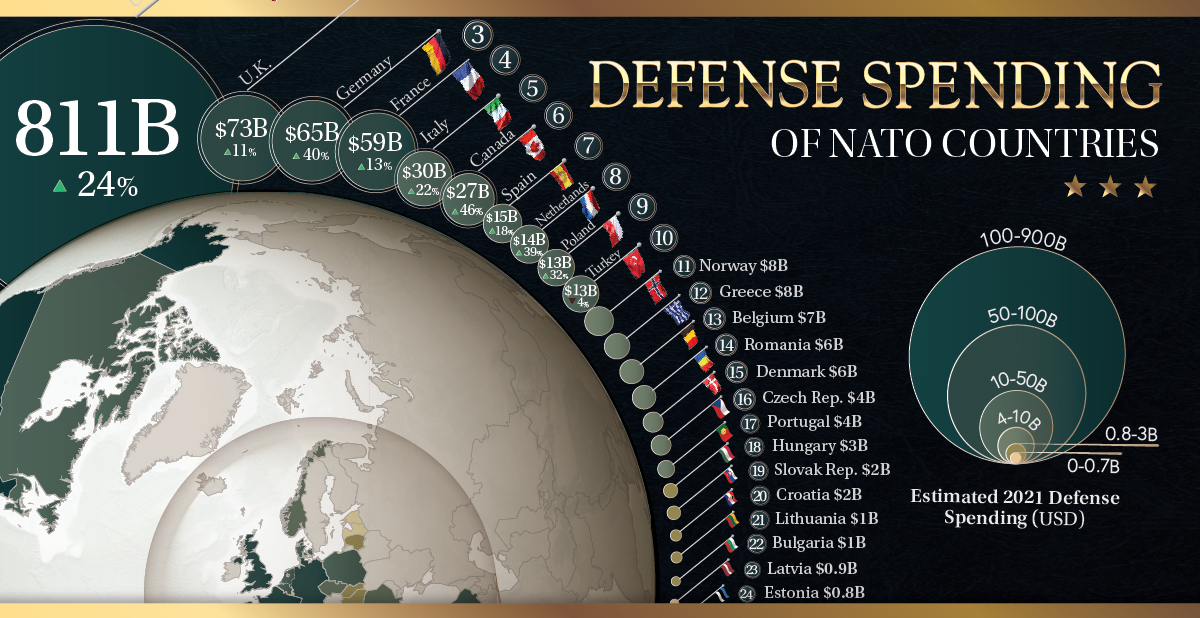
Using data from NATO, this map reveals what each NATO member country spends on its own national defense.
Note: Numbers are 2021 projections.
Biggest NATO Defense Spenders
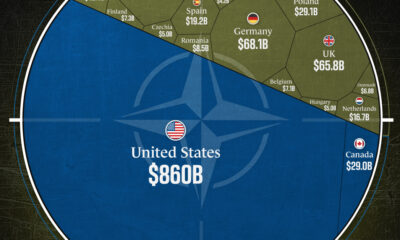
The U.S. spends more on defense than any other NATO country.
According to the 2021 estimates, U.S. defense spending will be close to $811 billion this year. On the other hand, the defense spending of all other NATO countries combined is projected to be $363 billion, meaning the U.S. will outspend all other countries by a whopping $448 billion.
| Rank | Country | Millions (USD) 2021p | Change (2014-2021) |
|---|---|---|---|
| #1 | 🇺🇸 United States | $811,140 | 24.0% |
| #2 | 🇬🇧 United Kingdom | $72,765 | 10.8% |
| #3 | 🇩🇪 Germany | $64,785 | 40.3% |
| #4 | 🇫🇷 France | $58,729 | 12.9% |
| #5 | 🇮🇹 Italy | $29,763 | 21.5% |
| #6 | 🇨🇦 Canada | $26,523 | 46.0% |
| #7 | 🇪🇸 Spain | $14,875 | 17.7% |
| #8 | 🇳🇱 Netherlands | $14,378 | 38.9% |
| #9 | 🇵🇱 Poland | $13,369 | 32.3% |
| #10 | 🇹🇷 Turkey | $13,057 | -3.8% |
| #11 | 🇳🇴 Norway | $8,292 | 7.4% |
| #12 | 🇬🇷 Greece | $8,014 | 53.1% |
| #13 | 🇧🇪 Belgium | $6,503 | 25.1% |
| #14 | 🇷🇴 Romania | $5,785 | 114.9% |
| #15 | 🇩🇰 Denmark | $5,522 | 36.1% |
| #16 | 🇨🇿 Czech Republic | $4,013 | 103.2% |
| #17 | 🇵🇹 Portugal | $3,975 | 32.2% |
| #18 | 🇭🇺 Hungary | $2,907 | 140.3% |
| #19 | 🇸🇰 Slovakia | $2,043 | 104.6% |
| #20 | 🇭🇷 Croatia | $1,846 | 73.6% |
| #21 | 🇱🇹 Lithuania | $1,278 | 198.8% |
| #22 | 🇧🇬 Bulgaria | $1,253 | 67.7% |
| #23 | 🇱🇻 Latvia | $851 | 189.9% |
| #24 | 🇪🇪 Estonia | $787 | 53.2% |
| #25 | 🇸🇮 Slovenia | $760 | 56.0% |
| #26 | 🇱🇺 Luxembourg | $474 | 87.4% |
| #27 | 🇦🇱 Albania | $239 | 33.8% |
| #28 | 🇲🇰 North Macedonia | $219 | 76.6% |
| #29 | 🇲🇪 Montenegro | $97 | 40.0% |
NATO is based on building up forces and equipment for the goal of joint security and defense. And, despite the pandemic, many members did increase their spending in 2020.
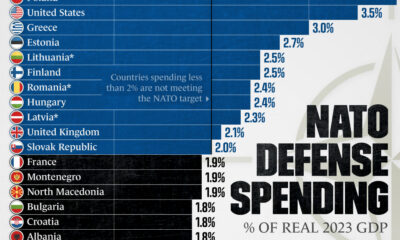
However, not all countries contribute equally. The agreed-upon target for European NATO members, for example, is to spend 2% of GDP on defense by 2024, but many countries are not on track to meet this goal.
Who Pays for NATO Itself?
One of the key pillars of NATO is collective defense: a commitment to the idea that an act of violence against one or more of its member states is an act of aggression towards all.
Collective defense, cooperative security, and crisis management are at the heart of NATO’s purpose and operations.
Apart from defense spending, running a transcontinental political alliance costs around $3 billion annually. So which countries foot the bill for these expenses?
| Country | Cost Share Arrangements (2021-2024) |
|---|---|
| 🇺🇸 United States | 16.36% |
| 🇩🇪 Germany | 16.36% |
| 🇬🇧 United Kingdom | 11.29% |
| 🇫🇷 France | 10.50% |
| 🇮🇹 Italy | 8.79% |
| 🇨🇦 Canada | 6.88% |
| 🇪🇸 Spain | 6.00% |
| 🇹🇷 Turkey | 4.73% |
| 🇳🇱 Netherlands | 3.45% |
| 🇵🇱 Poland | 2.99% |
| 🇧🇪 Belgium | 2.11% |
| 🇳🇴 Norway | 1.78% |
| 🇩🇰 Denmark | 1.31% |
| 🇷🇴 Romania | 1.23% |
| 🇬🇷 Greece | 1.06% |
| 🇨🇿 Czech Republic | 1.06% |
| 🇵🇹 Portugal | 1.05% |
| 🇭🇺 Hungary | 0.76% |
| 🇸🇰 Slovakia | 0.52% |
| 🇧🇬 Bulgaria | 0.37% |
| 🇭🇷 Croatia | 0.30% |
| 🇱🇹 Lithuania | 0.26% |
| 🇸🇮 Slovenia | 0.23% |
| 🇱🇺 Luxembourg | 0.17% |
| 🇱🇻 Latvia | 0.16% |
| 🇪🇪 Estonia | 0.12% |
| 🇦🇱 Albania | 0.09% |
| 🇮🇸 Iceland | 0.06% |
| 🇲🇪 Montenegro | 0.03% |
| Total | 100.00% |
Members have pre-arranged mechanisms to divide NATO alliance expenses evenly.
Getting into specifics, the members are paying for:
- Civilian staff wages and overhead costs of running NATO headquarters.
- Running strategic commands, joint operations, early warning and radar systems, training, etc.
- Defense communications systems, harbors, airfields, and fuel supplies.
The Future of NATO
While outright nation-on-nation conflict is becoming more rare, threats to the collective security of NATO allies have not disappeared.
While countries may have differing opinions over the exact amount each should contribute, rising expenditures are a sign that NATO is still a priority for the near future.


Politics
Charted: Trust in Government Institutions by G7 Countries
How much do you trust the government and its various institutions? We look at data for G7 countries for the time period of 2006-2023.


Trust in Government Institutions by G7 Countries
This was originally posted on our Voronoi app. Download the app for free on iOS or Android and discover incredible data-driven charts from a variety of trusted sources.
How much do you trust the government, and its various institutions?
It’s likely that your level of confidence probably depends on a wide range of factors, such as perceived competency, historical context, economic performance, accountability, social cohesion, and transparency.
And for these same reasons, trust levels in government institutions also change all the time, even in the world’s most developed countries: the G7.
Confidence in Government by G7 Countries (2006-2023)
This chart looks at the changes in trust in government institutions between the years 2006 and 2023, based on data from a multi-country Gallup poll.
Specifically, this dataset aggregates confidence in multiple national institutions, including the military, the judicial system, the national government, and the integrity of the electoral system.
| Country | Confidence (2006) | Confidence (2023) | Change (p.p.) |
|---|---|---|---|
| Canada | 57% | 64% | +7 |
| Britain | 63% | 63% | +0 |
| Germany | 55% | 61% | +6 |
| France | 54% | 60% | +6 |
| Japan | 48% | 59% | +11 |
| Italy | 41% | 54% | +13 |
| United States | 63% | 50% | -13 |
What’s interesting here is that in the G7, a group of the world’s most developed economies, there is only one country bucking the general trend: the United States.
Across most G7 countries, confidence in institutions has either improved or stayed the same between 2006 and 2023. The largest percentage point (p.p.) increases occur in Italy and Japan, which saw +13 p.p. and +11 p.p. increases in trust over the time period.
In the U.S., however, confidence in government institutions has fallen by 13 p.p. over the years. What happened?
Key Figures on U.S. Trust in Institutions
In 2006, the U.S. was tied with the UK as having the highest confidence in government institutions, at 63%.
But here’s where the scores stand in 2023, across various institutions:
| 🇺🇸 Institutions | Confidence (2023) |
|---|---|
| Military | 81% |
| Judiciary | 42% |
| National Government | 30% |
| Elections | 44% |
| Overall | 49% |
Based on this data, it’s clear that the U.S. lags behind in three key indicators: confidence in the national government, confidence in the justice system, and confidence in fair elections. It ranked in last place for each indicator in the G7.
One other data point that stands out: despite leading the world in military spending, the U.S. is only the third most confident in its military in the G7. It lags behind France (86%) and the United Kingdom (83%).

-

 Technology6 days ago
All of the Grants Given by the U.S. CHIPS Act
-

 Uranium2 weeks ago
The World’s Biggest Nuclear Energy Producers
-

 Education2 weeks ago
How Hard Is It to Get Into an Ivy League School?
-

 Debt2 weeks ago
How Debt-to-GDP Ratios Have Changed Since 2000
-

 Sports2 weeks ago
The Highest Earning Athletes in Seven Professional Sports
-

 Science2 weeks ago
Visualizing the Average Lifespans of Mammals
-

 Brands1 week ago
How Tech Logos Have Evolved Over Time
-

 Energy1 week ago
Ranked: The Top 10 EV Battery Manufacturers in 2023