Markets
The World’s Most Powerful Reserve Currencies
The World’s Most Powerful Reserve Currencies
When we think of network effects, we’re usually thinking of them in the context of technology and Metcalfe’s Law.
Metcalfe’s Law states that the more users that a network has, the more valuable it is to those users. It’s a powerful idea that is exploited by companies like LinkedIn, Airbnb, or Uber — all companies that provide a more beneficial service as their networks gain more nodes.
But network effects don’t apply just to technology and related fields.
In the financial sector, for example, stock exchanges grow in utility when they have more buyers, sellers, and volume. Likewise, in international finance, a currency can become increasingly entrenched when it’s accepted, used, and trusted all over the world.
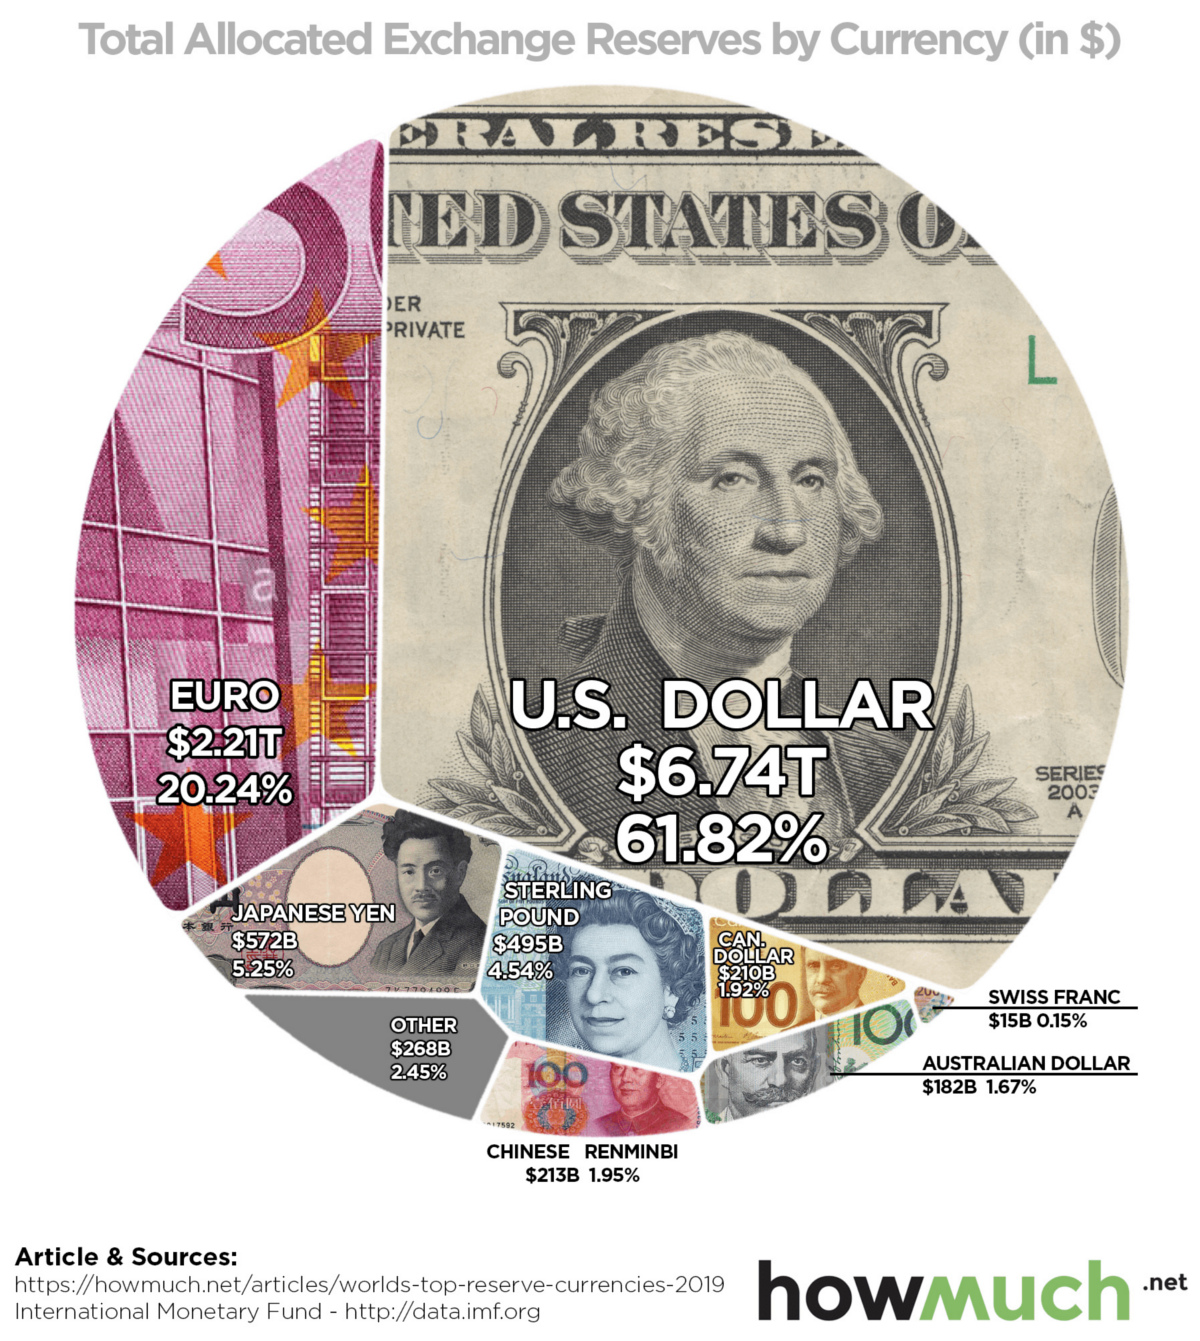
What’s a Reserve Currency?
Today’s visualization comes to us from HowMuch.net, and it breaks down foreign reserves held by countries — but what is a reserve currency, anyways?
In essence, reserve currencies (i.e. U.S. dollar, pound sterling, euro, etc.) are held on to by central banks for the following major reasons:
- To maintain a stable exchange rate for the domestic currency
- To ensure liquidity in the case of an economic or political crisis
- To provide confidence to international buyers and foreign investors
- To fulfill international obligations, such as paying down debt
- To diversify central bank portfolios, reducing overall risk
Not surprisingly, central banks benefit the most from stockpiling widely-held reserve currencies such as the U.S. dollar or the euro.
Because these currencies are accepted almost everywhere, they provide third-parties with extra confidence and perceived liquidity. This is a network effect that snowballs from the growing use of a particular reserve currency over others.
Reserve Currencies Over Time
Here is how the usage of reserve currencies has evolved over the last 15 years:
| 🇺🇸 U.S. Dollar | 🇪🇺 Euro | 🇯🇵 Japanese Yen | 🇬🇧 Pound Sterling | 🌐 Other | |
| 2004 | 65.5% | 24.7% | 4.3% | 3.5% | 2.0% |
| 2009 | 62.1% | 27.7% | 2.9% | 4.3% | 3.0% |
| 2014 | 65.1% | 21.2% | 3.5% | 3.7% | 6.5% |
| 2019 | 61.8% | 20.2% | 5.3% | 4.5% | 8.2% |
Over this timeframe, there have been small ups and downs in most reserve currencies.
Today, the U.S. dollar is the world’s most powerful reserve currency, making up over 61% of foreign reserves. The dollar gets an extensive network effect from its use abroad, and this translates into several advantages for the multi-trillion dollar U.S. economy.
The euro, yen, and pound sterling are the other mainstay reserve currencies, adding up to roughly 30% of foreign reserves.
Finally, the most peculiar data series above is “Other”, which grew from 2.0% to 8.4% of worldwide foreign reserves over the last 15 years. This bucket includes the Canadian dollar, the Australian dollar, the Swiss franc, and the Chinese renminbi.
Accepted Everywhere?
There have been rumblings in the media for decades now about the rise of the Chinese renminbi as a potential new challenger on the reserve currency front.
While there are still big structural problems that will prevent this from happening as fast as some may expect, the currency is still on the rise internationally.
What will the composition of global foreign reserves look like in another 15 years?


Markets
The European Stock Market: Attractive Valuations Offer Opportunities
On average, the European stock market has valuations that are nearly 50% lower than U.S. valuations. But how can you access the market?


European Stock Market: Attractive Valuations Offer Opportunities
Europe is known for some established brands, from L’Oréal to Louis Vuitton. However, the European stock market offers additional opportunities that may be lesser known.
The above infographic, sponsored by STOXX, outlines why investors may want to consider European stocks.
Attractive Valuations
Compared to most North American and Asian markets, European stocks offer lower or comparable valuations.
| Index | Price-to-Earnings Ratio | Price-to-Book Ratio |
|---|---|---|
| EURO STOXX 50 | 14.9 | 2.2 |
| STOXX Europe 600 | 14.4 | 2 |
| U.S. | 25.9 | 4.7 |
| Canada | 16.1 | 1.8 |
| Japan | 15.4 | 1.6 |
| Asia Pacific ex. China | 17.1 | 1.8 |
Data as of February 29, 2024. See graphic for full index names. Ratios based on trailing 12 month financials. The price to earnings ratio excludes companies with negative earnings.
On average, European valuations are nearly 50% lower than U.S. valuations, potentially offering an affordable entry point for investors.
Research also shows that lower price ratios have historically led to higher long-term returns.
Market Movements Not Closely Connected
Over the last decade, the European stock market had low-to-moderate correlation with North American and Asian equities.
The below chart shows correlations from February 2014 to February 2024. A value closer to zero indicates low correlation, while a value of one would indicate that two regions are moving in perfect unison.
| EURO STOXX 50 | STOXX EUROPE 600 | U.S. | Canada | Japan | Asia Pacific ex. China |
|
|---|---|---|---|---|---|---|
| EURO STOXX 50 | 1.00 | 0.97 | 0.55 | 0.67 | 0.24 | 0.43 |
| STOXX EUROPE 600 | 1.00 | 0.56 | 0.71 | 0.28 | 0.48 | |
| U.S. | 1.00 | 0.73 | 0.12 | 0.25 | ||
| Canada | 1.00 | 0.22 | 0.40 | |||
| Japan | 1.00 | 0.88 | ||||
| Asia Pacific ex. China | 1.00 |
Data is based on daily USD returns.
European equities had relatively independent market movements from North American and Asian markets. One contributing factor could be the differing sector weights in each market. For instance, technology makes up a quarter of the U.S. market, but health care and industrials dominate the broader European market.
Ultimately, European equities can enhance portfolio diversification and have the potential to mitigate risk for investors.
Tracking the Market
For investors interested in European equities, STOXX offers a variety of flagship indices:
| Index | Description | Market Cap |
|---|---|---|
| STOXX Europe 600 | Pan-regional, broad market | €10.5T |
| STOXX Developed Europe | Pan-regional, broad-market | €9.9T |
| STOXX Europe 600 ESG-X | Pan-regional, broad market, sustainability focus | €9.7T |
| STOXX Europe 50 | Pan-regional, blue-chip | €5.1T |
| EURO STOXX 50 | Eurozone, blue-chip | €3.5T |
Data is as of February 29, 2024. Market cap is free float, which represents the shares that are readily available for public trading on stock exchanges.
The EURO STOXX 50 tracks the Eurozone’s biggest and most traded companies. It also underlies one of the world’s largest ranges of ETFs and mutual funds. As of November 2023, there were €27.3 billion in ETFs and €23.5B in mutual fund assets under management tracking the index.
“For the past 25 years, the EURO STOXX 50 has served as an accurate, reliable and tradable representation of the Eurozone equity market.”
— Axel Lomholt, General Manager at STOXX
Partnering with STOXX to Track the European Stock Market
Are you interested in European equities? STOXX can be a valuable partner:
- Comprehensive, liquid and investable ecosystem
- European heritage, global reach
- Highly sophisticated customization capabilities
- Open architecture approach to using data
- Close partnerships with clients
- Part of ISS STOXX and Deutsche Börse Group
With a full suite of indices, STOXX can help you benchmark against the European stock market.
Learn how STOXX’s European indices offer liquid and effective market access.

-

 Economy2 days ago
Economic Growth Forecasts for G7 and BRICS Countries in 2024
The IMF has released its economic growth forecasts for 2024. How do the G7 and BRICS countries compare?
-

 Markets1 week ago
U.S. Debt Interest Payments Reach $1 Trillion
U.S. debt interest payments have surged past the $1 trillion dollar mark, amid high interest rates and an ever-expanding debt burden.
-

 United States2 weeks ago
Ranked: The Largest U.S. Corporations by Number of Employees
We visualized the top U.S. companies by employees, revealing the massive scale of retailers like Walmart, Target, and Home Depot.
-

 Markets2 weeks ago
The Top 10 States by Real GDP Growth in 2023
This graphic shows the states with the highest real GDP growth rate in 2023, largely propelled by the oil and gas boom.
-

 Markets2 weeks ago
Ranked: The World’s Top Flight Routes, by Revenue
In this graphic, we show the highest earning flight routes globally as air travel continued to rebound in 2023.
-

 Markets2 weeks ago
Ranked: The Most Valuable Housing Markets in America
The U.S. residential real estate market is worth a staggering $47.5 trillion. Here are the most valuable housing markets in the country.


-

 Energy1 week ago
The World’s Biggest Nuclear Energy Producers
-

 Money2 weeks ago
Which States Have the Highest Minimum Wage in America?
-

 Technology2 weeks ago
Ranked: Semiconductor Companies by Industry Revenue Share
-
Markets2 weeks ago
Ranked: The World’s Top Flight Routes, by Revenue
-

 Countries2 weeks ago
Population Projections: The World’s 6 Largest Countries in 2075
-
Markets2 weeks ago
The Top 10 States by Real GDP Growth in 2023
-

 Demographics2 weeks ago
The Smallest Gender Wage Gaps in OECD Countries
-

 United States2 weeks ago
Where U.S. Inflation Hit the Hardest in March 2024