United States
The Top 100 Companies of the World: The U.S. vs Everyone Else


The Top 100 Companies of the World: U.S. vs Everyone
When it comes to breaking down the top 100 companies of the world, the United States still commands the largest slice of the pie.
Throughout the 20th century and before globalization reached its current peaks, American companies made the country an economic powerhouse and the source of a majority of global market value.
But even as countries like China have made headway with multi-billion dollar companies of their own, and the market’s most important sectors have shifted, the U.S. has managed to stay on top.
How do the top 100 companies of the world stack up? This visualization pulls from PwC’s annual ranking of the world’s largest companies, using market capitalization data from May 2021.
Where are the World’s Largest Companies Located?
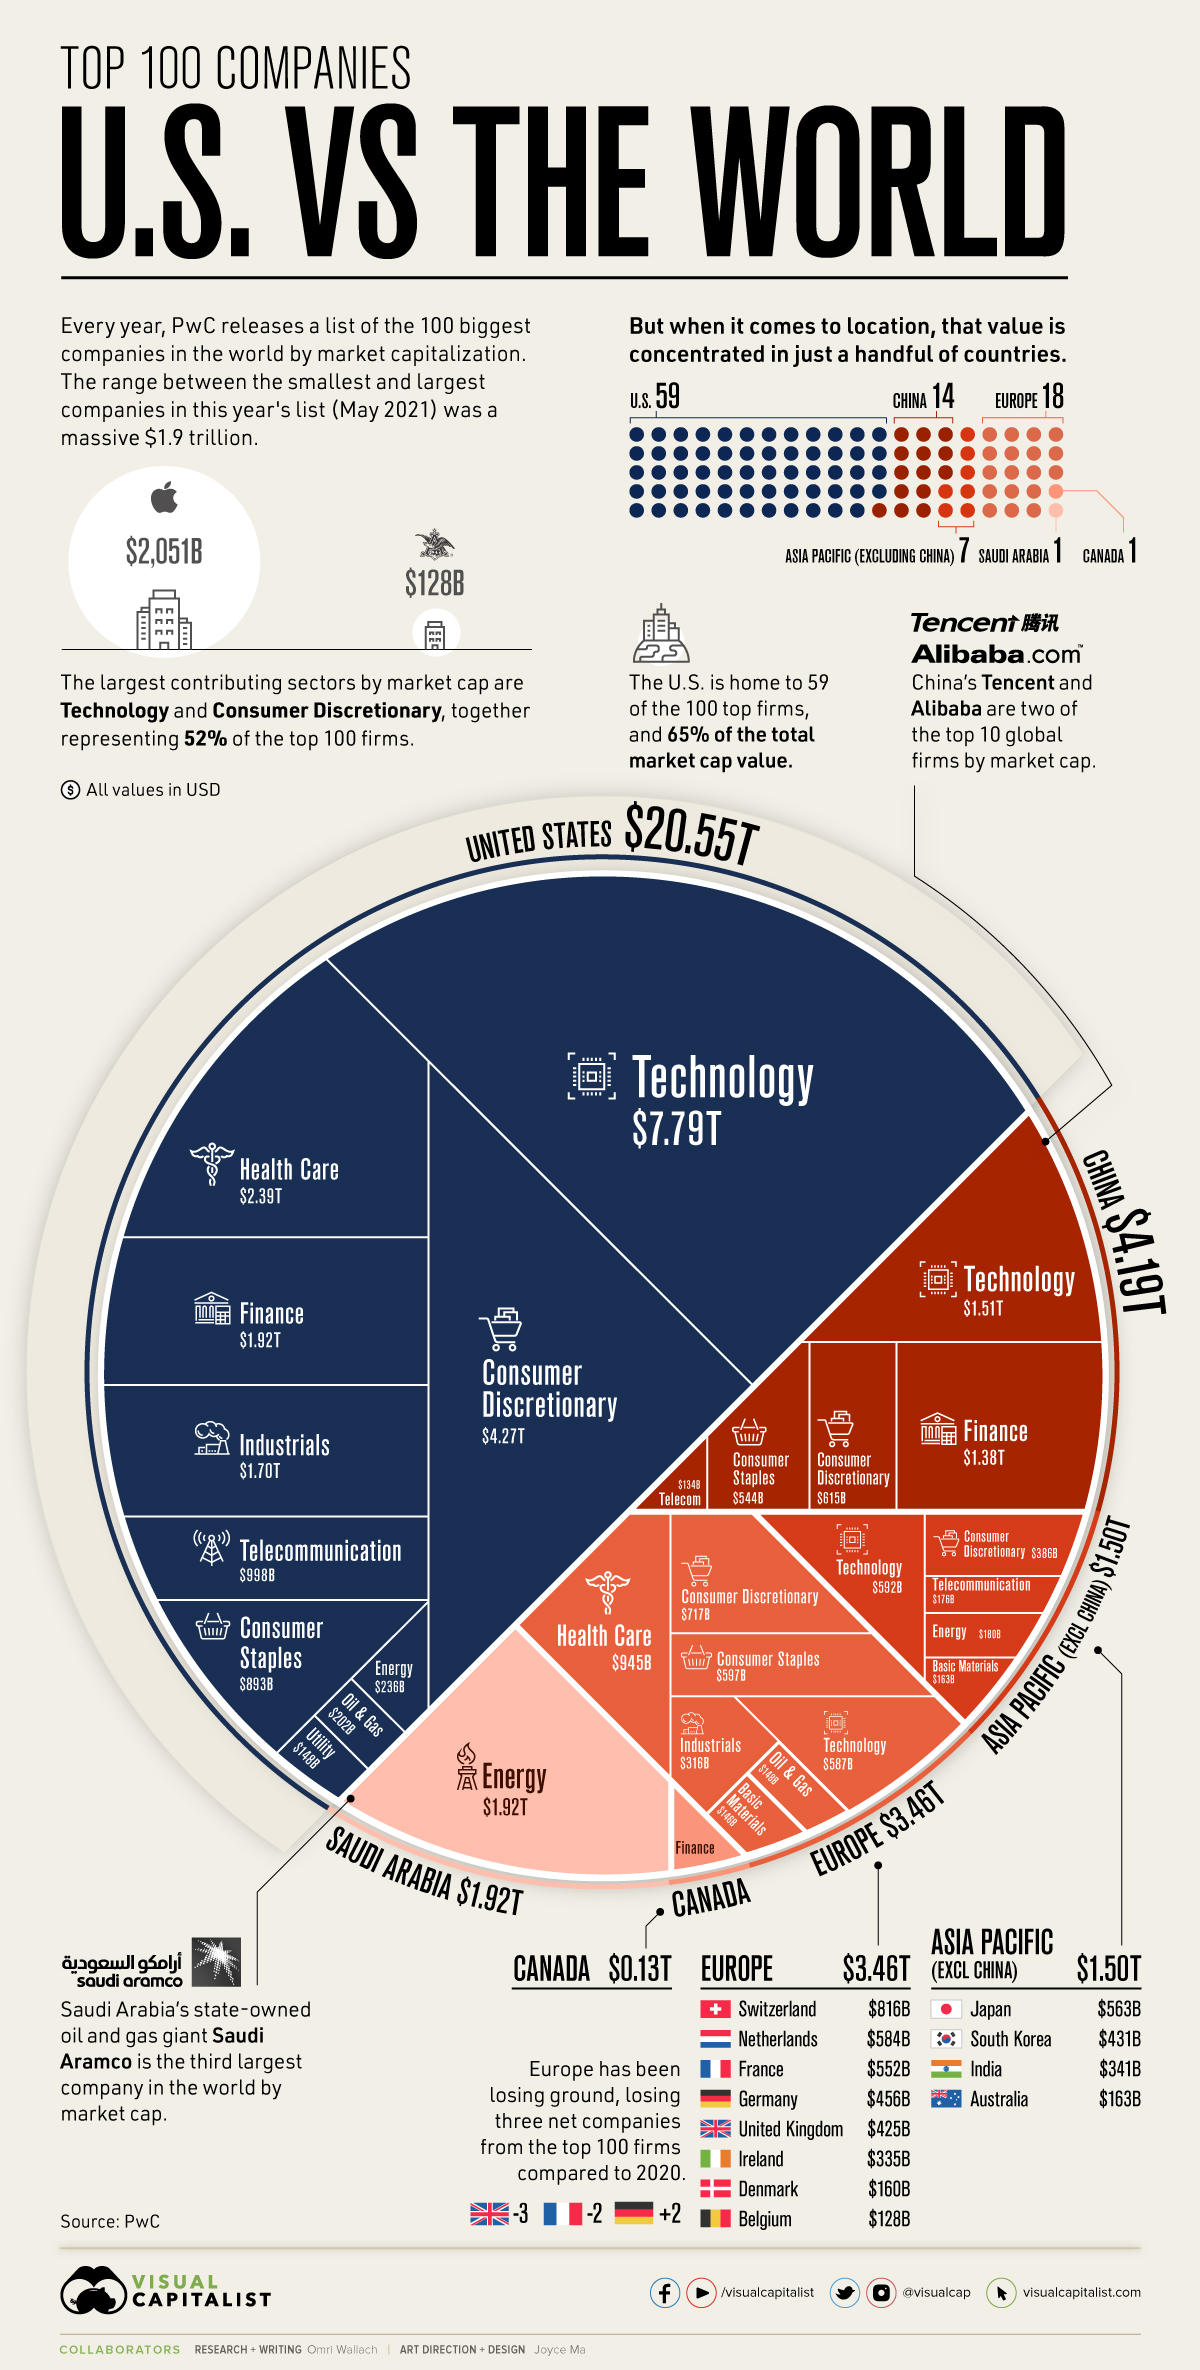
The world’s top 100 companies account for a massive $31.7 trillion in market cap, but that wealth is not distributed evenly.
Between companies, there’s a wide range of market caps. For example, the difference between the world’s largest company (Apple) and the 100th largest (Anheuser-Busch) is $1.9 trillion.
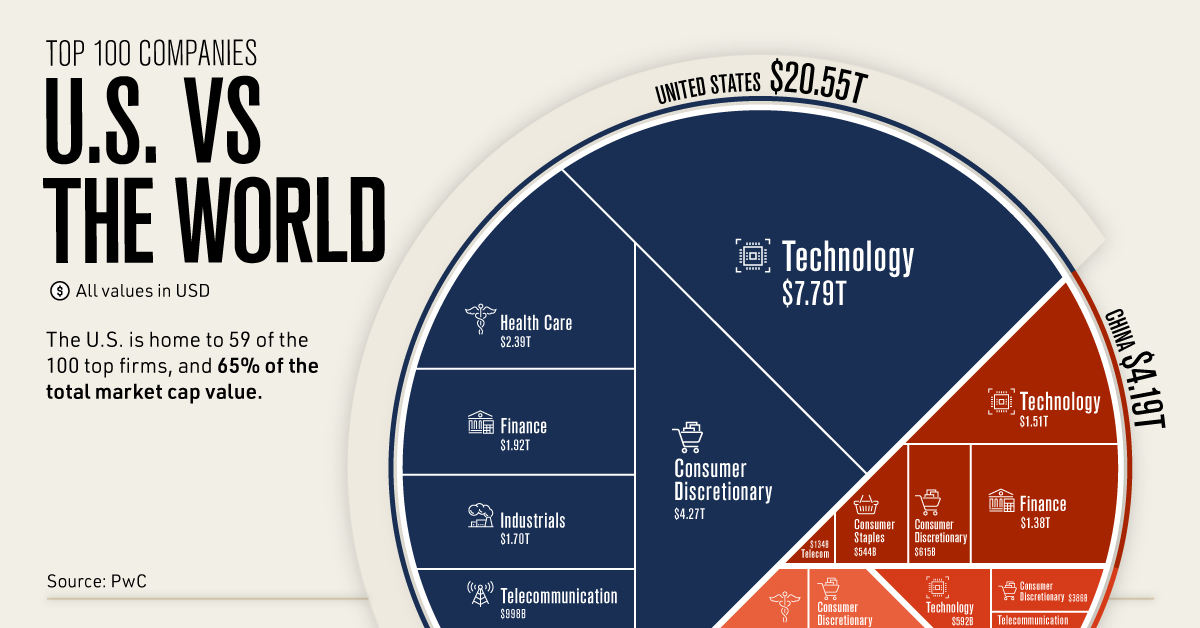
And between countries, that divide becomes even more stark. Of the 16 countries with companies making the top 100 ranking, the U.S. accounts for 65% of the total market cap value.
| Location | # of Companies | Market Capitalization (May 2021) |
|---|---|---|
| 🇺🇸 United States | 59 | $20.55T |
| 🇨🇳 China | 14 | $4.19T |
| 🇸🇦 Saudi Arabia | 1 | $1.92T |
| 🇨🇭 Switzerland | 3 | $0.82T |
| 🇳🇱 Netherlands | 3 | $0.58T |
| 🇯🇵 Japan | 3 | $0.56T |
| 🇫🇷 France | 2 | $0.55T |
| 🇩🇪 Germany | 3 | $0.46T |
| 🇰🇷 South Korea | 1 | $0.43T |
| 🇬🇧 United Kingdom | 3 | $0.43T |
| 🇮🇳 India | 2 | $0.34T |
| 🇮🇪 Ireland | 2 | $0.34T |
| 🇦🇺 Australia | 1 | $0.16T |
| 🇩🇰 Denmark | 1 | $0.16T |
| 🇨🇦 Canada | 1 | $0.13T |
| 🇧🇪 Belgium | 1 | $0.13T |
Compared to the U.S., other once-prominent markets like Japan, France, and the UK have seen their share of the world’s top 100 companies falter over the years. In fact, all of Europe accounts for just $3.46 trillion or 11% of the total market cap value of the list.
A major reason for the U.S. dominance in market values is a shift in important industries and contributors. Of the world’s top 100 companies, 52% were based in either technology or consumer discretionary, and the current largest players like Apple, Alphabet, Tesla, and Walmart are all American-based.
The Top 100 Companies of the World: Competition From China
The biggest and most impressive competitor to the U.S. is China.
With 14 companies of its own in the world’s top 100, China accounted for $4.19 trillion or 13% of the top 100’s total market cap value. That includes two of the top 10 firms by market cap, Tencent and Alibaba.
| Company | Country | Sector | Market Cap (May 2021) | |
|---|---|---|---|---|
| #1 | Apple | United States | Technology | $2,051B |
| #2 | Saudi Aramco | Saudi Arabia | Energy | $1,920B |
| #3 | Microsoft | United States | Technology | $1,778B |
| #4 | Amazon | United States | Consumer Discretionary | $1,558B |
| #5 | Alphabet | United States | Technology | $1,393B |
| #6 | United States | Technology | $839B | |
| #7 | Tencent | China | Technology | $753B |
| #8 | Tesla | United States | Consumer Discretionary | $641B |
| #9 | Alibaba | China | Consumer Discretionary | $615B |
| #10 | Berkshire Hathway | United States | Financials | $588B |
| #11 | TSMC | China | Technology | $534B |
| #12 | Visa | United States | Industrials | $468B |
| #13 | JPMorgan Chase | United States | Financials | $465B |
| #14 | Johnson & Johnson | United States | Health Care | $433B |
| #15 | Samsung Electronics | South Korea | Technology | $431B |
| #16 | Kweichow Moutai | China | Consumer Staples | $385B |
| #17 | Walmart | United States | Consumer Discretionary | $383B |
| #18 | Mastercard | United States | Industrials | $354B |
| #19 | UnitedHealth Group | United States | Health Care | $352B |
| #20 | LVMH Moët Hennessy | France | Consumer Discretionary | $337B |
| #21 | Walt Disney Co | United States | Consumer Discretionary | $335B |
| #22 | Bank of America | United States | Financials | $334B |
| #23 | Procter & Gamble | United States | Consumer Staples | $333B |
| #24 | Nvidia | United States | Technology | $331B |
| #25 | Home Depot | United States | Consumer Discretionary | $329B |
| #26 | Nestle SA | Switzerland | Consumer Staples | $322B |
| #27 | ICBC | China | Financials | $290B |
| #28 | Paypal Holdings | United States | Industrials | $284B |
| #29 | Roche Holdings | Switzerland | Health Care | $283B |
| #30 | Intel | United States | Technology | $261B |
| #31 | ASML Holding NV | Netherlands | Technology | $255B |
| #32 | Toyota Motor | Japan | Consumer Discretionary | $254B |
| #33 | Comcast | United States | Telecommunication | $248B |
| #34 | Verizon Communications | United States | Telecommunication | $241B |
| #35 | Exxon Mobil | United States | Energy | $236B |
| #36 | Netflix | United States | Consumer Discretionary | $231B |
| #37 | Adobe | United States | Technology | $228B |
| #38 | Coca-Cola Co | United States | Consumer Staples | $227B |
| #39 | Meituan | China | Technology | $226B |
| #40 | Ping An | China | Financials | $219B |
| #41 | Cisco Systems | United States | Telecommunication | $218B |
| #42 | AT&T | United States | Financials | $216B |
| #43 | L'Oréal | France | Consumer Discretionary | $215B |
| #44 | China Construction Bank | China | Financials | $213B |
| #45 | Abbott Labs | United States | Health Care | $212B |
| #46 | Novartis AG | Switzerland | Health Care | $212B |
| #47 | Nike | United States | Consumer Discretionary | $209B |
| #48 | Oracle | United States | Technology | $202B |
| #49 | Pfizer | United States | Health Care | $202B |
| #50 | Chevron | United States | Oil & Gas | $202B |
| #51 | China Merchants Bank | China | Financials | $196B |
| #52 | PepsiCo | United States | Consumer Staples | $195B |
| #53 | Salesforce.com | United States | Technology | $195B |
| #54 | Merck & Co | United States | Health Care | $195B |
| #55 | AbbVie | United States | Health Care | $191B |
| #56 | Broadcom | United States | Technology | $189B |
| #57 | Prosus NV | Netherlands | Technology | $181B |
| #58 | Reliance Industries | India | Energy | $180B |
| #59 | Thermo Fisher Scientific | United States | Health Care | $180B |
| #60 | Eli Lilly & Co | United States | Health Care | $179B |
| #61 | Agricultural Bank of China | China | Financials | $178B |
| #62 | Softbank Group | Japan | Telecommunication | $176B |
| #63 | Accenture | Ireland | Industrials | $176B |
| #64 | Texas Instruments | United States | Technology | $174B |
| #65 | McDonalds | United States | Consumer Discretionary | $167B |
| #66 | Volkswagen AG | Germany | Consumer Discretionary | $165B |
| #67 | BHP Group | Australia | Basic Materials | $163B |
| #68 | Wells Fargo & Co | United States | Financials | $162B |
| #69 | Tata Consultancy Services | India | Technology | $161B |
| #70 | Danaher | United States | Health Care | $160B |
| #71 | Novo Nordisk | Denmark | Health Care | $160B |
| #72 | Medtronic | Ireland | Health Care | $159B |
| #73 | Wuliangye Yibin | China | Consumer Staples | $159B |
| #74 | Costco Wholesale | United States | Consumer Discretionary | $156B |
| #75 | T-Mobile US | United States | Telecommunication | $156B |
| #76 | Citigroup | United States | Financials | $152B |
| #77 | Honeywell | United States | Industrials | $151B |
| #78 | Qualcomm | United States | Technology | $151B |
| #79 | SAP SE | Germany | Technology | $151B |
| #80 | Boeing | United States | Industrials | $149B |
| #81 | Royal Dutch Shell | Netherlands | Oil & Gas | $148B |
| #82 | NextEra Energy | United States | Utilities | $148B |
| #83 | United Parcel Service | United States | Industrials | $148B |
| #84 | Union PAC | United States | Industrials | $148B |
| #85 | Unilever | United Kingdom | Consumer Staples | $147B |
| #86 | AIA | China | Financials | $147B |
| #87 | Linde | United Kingdom | Basic Materials | $146B |
| #88 | Amgen | United States | Health Care | $144B |
| #89 | Bristol Myers Squibb | United States | Health Care | $141B |
| #90 | Siemens AG | Germany | Industrials | $140B |
| #91 | Bank of China | China | Financials | $139B |
| #92 | Philip Morris | United States | Consumer Staples | $138B |
| #93 | Lowe's Companies | United States | Consumer Discretionary | $136B |
| #94 | Charter Communications | United States | Telecommunication | $135B |
| #95 | China Mobile | China | Telecommunication | $134B |
| #96 | Sony Group | Japan | Consumer Discretionary | $132B |
| #97 | Astrazeneca | United Kingdom | Health Care | $131B |
| #98 | Royal Bank of Canada | Canada | Financials | $131B |
| #99 | Starbucks | United States | Consumer Discretionary | $129B |
| #100 | Anheuser-Busch | Belgium | Consumer Staples | $128B |
Impressively, China’s rise in market value isn’t limited to well-known tech and consumer companies. The country’s second biggest contributing industry to the top 100 firms was finance, once also the most valuable sector in the U.S. (currently 4th behind tech, consumer discretionary, and health care).
Other notable countries on the list include Saudi Arabia and its state-owned oil and gas giant Saudi Aramco, which is the third largest company in the world. Despite only having one company in the top 100, Saudi Arabia had the third-largest share of the top 100’s total market cap value.
As Europe continues to lose ground year-over-year and the rest of Asia struggles to keep up, the top 100 companies might become increasingly concentrated in just the U.S. and China. The question is, will the imbalance of global market value start to even out, or become even bigger?


Politics
Charted: Trust in Government Institutions by G7 Countries
How much do you trust the government and its various institutions? We look at data for G7 countries for the time period of 2006-2023.


Trust in Government Institutions by G7 Countries
This was originally posted on our Voronoi app. Download the app for free on iOS or Android and discover incredible data-driven charts from a variety of trusted sources.
How much do you trust the government, and its various institutions?
It’s likely that your level of confidence probably depends on a wide range of factors, such as perceived competency, historical context, economic performance, accountability, social cohesion, and transparency.
And for these same reasons, trust levels in government institutions also change all the time, even in the world’s most developed countries: the G7.
Confidence in Government by G7 Countries (2006-2023)
This chart looks at the changes in trust in government institutions between the years 2006 and 2023, based on data from a multi-country Gallup poll.
Specifically, this dataset aggregates confidence in multiple national institutions, including the military, the judicial system, the national government, and the integrity of the electoral system.
| Country | Confidence (2006) | Confidence (2023) | Change (p.p.) |
|---|---|---|---|
| Canada | 57% | 64% | +7 |
| Britain | 63% | 63% | +0 |
| Germany | 55% | 61% | +6 |
| France | 54% | 60% | +6 |
| Japan | 48% | 59% | +11 |
| Italy | 41% | 54% | +13 |
| United States | 63% | 50% | -13 |
What’s interesting here is that in the G7, a group of the world’s most developed economies, there is only one country bucking the general trend: the United States.
Across most G7 countries, confidence in institutions has either improved or stayed the same between 2006 and 2023. The largest percentage point (p.p.) increases occur in Italy and Japan, which saw +13 p.p. and +11 p.p. increases in trust over the time period.
In the U.S., however, confidence in government institutions has fallen by 13 p.p. over the years. What happened?
Key Figures on U.S. Trust in Institutions
In 2006, the U.S. was tied with the UK as having the highest confidence in government institutions, at 63%.
But here’s where the scores stand in 2023, across various institutions:
| 🇺🇸 Institutions | Confidence (2023) |
|---|---|
| Military | 81% |
| Judiciary | 42% |
| National Government | 30% |
| Elections | 44% |
| Overall | 49% |
Based on this data, it’s clear that the U.S. lags behind in three key indicators: confidence in the national government, confidence in the justice system, and confidence in fair elections. It ranked in last place for each indicator in the G7.
One other data point that stands out: despite leading the world in military spending, the U.S. is only the third most confident in its military in the G7. It lags behind France (86%) and the United Kingdom (83%).

-

 Wealth6 days ago
Charted: Which City Has the Most Billionaires in 2024?
-

 Mining2 weeks ago
Gold vs. S&P 500: Which Has Grown More Over Five Years?
-

 Uranium2 weeks ago
The World’s Biggest Nuclear Energy Producers
-

 Education2 weeks ago
How Hard Is It to Get Into an Ivy League School?
-

 Debt2 weeks ago
How Debt-to-GDP Ratios Have Changed Since 2000
-

 Sports2 weeks ago
The Highest Earning Athletes in Seven Professional Sports
-

 Science2 weeks ago
Visualizing the Average Lifespans of Mammals
-

 Brands1 week ago
How Tech Logos Have Evolved Over Time