Finance
The Stocks to Rule Them All: Big Tech’s Might in Five Charts


The Stocks to Rule them All: Big Tech’s Might in Five Charts
American’s tech giants have caught the public’s attention as of late.
Four of the Big Five recently appeared in front of U.S. Congress to discuss their anti-competitive business practices and privacy concerns.
Yet business is booming. Compared to the traditional economy, Big Tech operates within an intangible realm of business. This enables them to move faster, cheaper, and more profitably—with business models that possess widespread scale via the internet.
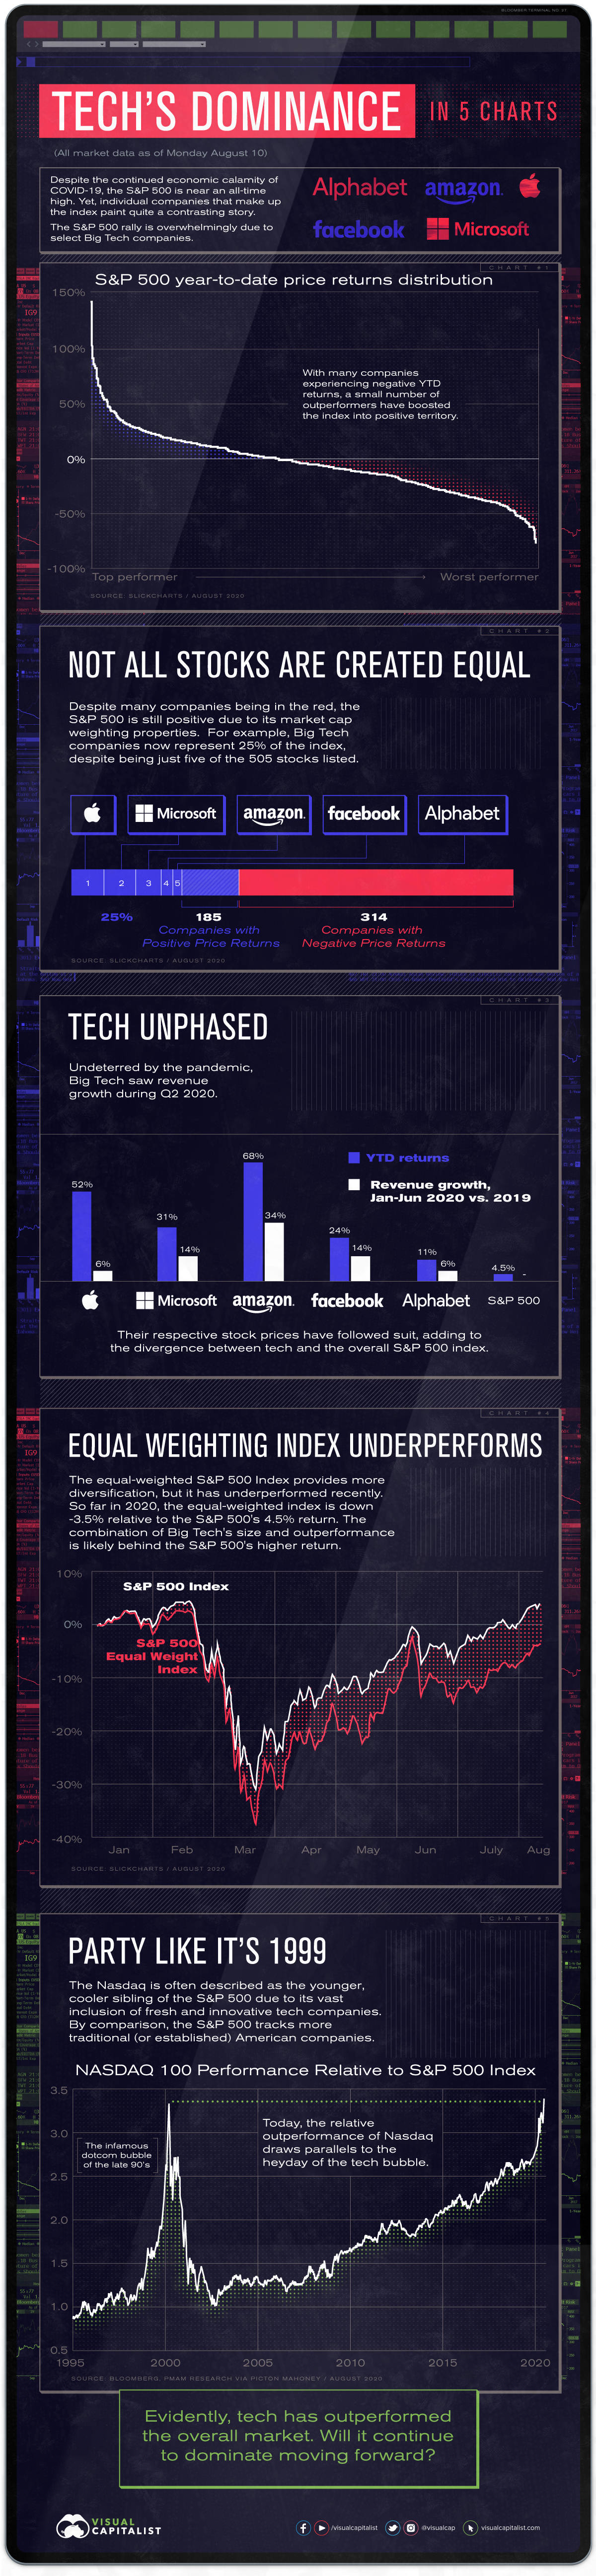
The above five charts are a reflection of Big Tech’s momentum and the significant role they have played in the swift and vigorous market recovery. Let’s take a closer look at the data.
| Company | Market Capitalization (In Billions) | Weighting in the S&P 500 Index |
|---|---|---|
| Apple | $1,930 | 7.1% |
| Microsoft | $1,590 | 5.9% |
| Amazon | $1,590 | 5.9% |
| Alphabet | $1,030 | 3.8% |
| $742 | 2.7% | |
| Total | $6,883 | 25.41% |
| S&P 500 | $27,050 | 100% |
Not All Stocks Are Created Equal
Of the 505 stocks that make up the S&P 500 Index, only about a third have experienced positive returns year-to-date (YTD), with the remaining stocks in the red.
Despite the majority of companies underperforming, the S&P 500 has generated a positive year-to-date return. This is due to the fact that companies are weighted according to market capitalization. For example, the Big Five now represent 25% of the index, despite being just five of the 505 stocks listed.
Big Tech’s dominance is being driven by ballooning market valuations. For instance, Apple reached the $1 trillion valuation in August 2018, and now the company is awfully close to topping the $2 trillion mark after just two years. This is just one of many examples that illustrate the growing power of Big Tech.
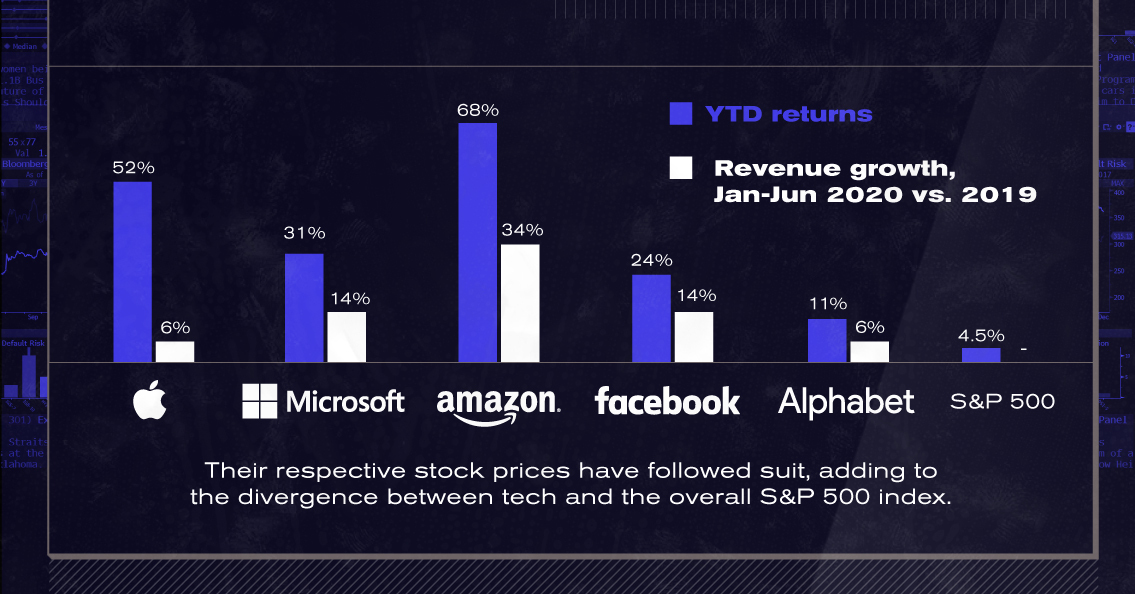
Pandemic Proof?
The five Big Tech companies are also seeing business as usual, with revenues in the first half of the year growing steadily compared to the first half of 2019.
| Company | YTD Price Returns | Revenue Growth (H1 2020 vs. 2019) |
|---|---|---|
| Apple | 52% | 6% |
| Microsoft | 31% | 14% |
| Amazon | 68% | 34% |
| 24% | 14% | |
| Alphabet | 11% | 6% |
| S&P 500 | 4.5% |
Their respective stock prices have followed suit, adding to the divergence between the performance of tech and the overall S&P 500 Index.
The equal-weighted S&P 500 Index provides diversification, but it has underperformed recently. Year-to-date, the equal-weighted index is down -3.5% relative to the positive 4.5% seen for the S&P 500, a spread of 8%. The combination of Big Tech’s outperformance and large weighting is likely behind the index staying afloat.
Dissecting the Disconnect
You may notice the phrase “stock market disconnect” reverberating recently, reflecting consumer views on the state of financial markets and their relationship with the economy, or lack thereof. While the economy combats record levels of unemployment and a plethora of bankruptcies, major American indexes edge closer to record highs.
This disconnect can be explained by the market capitalization weighted qualities of these indexes as well as the geographic source of company revenues in the S&P 500.
The most visible businesses to the everyday individual represent a small and vulnerable basket of companies that account for a undersized component of the stock market. No matter how clobbered they get, their effects on the market as a whole are miniscule.
A Global Footprint
In the era of globalization, American companies are more diversified than ever. Their revenue streams carry a greater global presence, meaning domestic revenues in the United States are less crucial than in times past. For example, the S&P 500’s foreign revenue exposure stands at 42.9% in 2018 and these figures are even higher for Big Tech stocks.
| Revenues Recognized Outside of North America/America | |
|---|---|
| Apple | 55% |
| Microsoft | 41% |
| Amazon | 31% |
| Alphabet | 51% |
| 54% | |
| Average | 46% |
Big Tech has outdone itself by virtually any measure.
They’ve shown their capacity to translate headwinds to tailwinds, even under challenging economic circumstances. Going forward, estimates by analysts on Wall Street suggest that even more growth for these companies could be on the horizon.


Green
How Carbon Credits Can Help Close the Climate Funding Gap
To keep a 1.5℃ world within reach, global emissions need to fall by as much as 45% by 2030, and carbon credits could help close the gap.


How Carbon Credits Can Help Close the Climate Funding Gap
Governments around the world have committed to the goals of the Paris Agreement, but their climate pledges are insufficient. To keep a 1.5℃ world within reach, global emissions need to fall by as much as 45% by 2030.
Bold and immediate action is essential, but so are resources that will make it happen.
In this graphic, we have partnered with Carbon Streaming to look at the role that the voluntary carbon market and carbon credits can play in closing that gap.
More Funds are Needed for Climate Finance
According to data from the Climate Policy Initiative, climate finance, which includes funds for both adaptation and mitigation, needs to increase at least five-fold, from $1.3T in 2021/2022, to an average $8.6T annually until 2030, and then to just over $10T in the two decades leading up to 2050.
That adds up to a very large number, but consider that in 2022, $7.0T went to fossil fuel subsidies, which almost covers the annual estimated outlay. And the world has shown that when pressed, governments can come up with the money, if the global pandemic is any indication.
Mobilizing Carbon Finance to the Developing World
But the same cannot be said of the developing world, where debt, inequality, and poverty reduce the ability of governments to act. And this is where carbon credits can play an important role. According to analyses from Ecosystem Marketplace, carbon credits help move capital from developed countries, to where funds are needed in the developing world.
For example, in 2019, 69.2% of the carbon credits by volume in the voluntary carbon market were purchased by buyers in Europe, and nearly a third from North America. Compare that to over 90% of the volume of carbon credits sold in the voluntary carbon market in 2022 came from projects that were located outside of those two regions.
Carbon Credits Can Complement Decarbonization Efforts
Carbon credits can also complement decarbonization efforts in the corporate world, where more and more companies have been signing up to reduce emissions. According to the 2022 monitoring report from the Science Based Targets initiative, 4,230 companies around the world had approved targets and commitments, which represented an 88% increase from the prior year. However, as of year end 2022, combined scope 1 and 2 emissions covered by science-based targets totaled approximately 2 GtCO2e, which represents just a fraction of global emissions.
The fine print is that this is just scope 1 and 2 emissions, and doesn’t include scope 3 emissions, which can account for more than 70% of a company’s total emissions. And as these emissions come under greater and greater scrutiny the closer we get to 2030 and beyond, the voluntary carbon credit market could expand exponentially to help meet the need to compensate for these emissions.
Potential Carbon Credit Market Size in 2030
OK, but how big? In 2022, the voluntary carbon credit market was around $2B, but some analysts predict that it could grow to between $5–250 billion by 2030.
| Firm | Low Estimate | High Estimate |
|---|---|---|
| Bain & Company | $15B | $30B |
| Barclays | N/A | $250B |
| Citigroup | $5B | $50B |
| McKinsey & Company | $5B | $50B |
| Morgan Stanley | N/A | $100B |
| Shell / Boston Consulting Group | $10B | $40B |
Morgan Stanley and Barclays were the most bullish on the size of the voluntary carbon credit market in 2030, but the latter firm was even more optimistic about 2050, and predicted that the voluntary carbon credit market could grow to a colossal $1.5 trillion.
Carbon Streaming is Focused on Carbon Credit Integrity
Ultimately, carbon credits could have an important role to play in marshaling the resources needed to keep the world on track to net zero by 2050, and avoiding the worst consequences of a warming world.
Carbon Streaming uses streaming transactions, a proven and flexible funding model, to scale high-integrity carbon credit projects to advance global climate action and UN Sustainable Development Goals.
Learn more at www.carbonstreaming.com.

-

 Green5 hours ago
The Carbon Footprint of Major Travel Methods
Going on a cruise ship and flying domestically are the most carbon-intensive travel methods.
-

 Green2 weeks ago
Ranking the Top 15 Countries by Carbon Tax Revenue
This graphic highlights France and Canada as the global leaders when it comes to generating carbon tax revenue.
-

 Green2 weeks ago
Ranked: The Countries With the Most Air Pollution in 2023
South Asian nations are the global hotspot for pollution. In this graphic, we rank the world’s most polluted countries according to IQAir.
-

 Green2 weeks ago
Top Countries By Forest Growth Since 2001
One country is taking reforestation very seriously, registering more than 400,000 square km of forest growth in two decades.
-

 Green3 weeks ago
Ranked: Top Countries by Total Forest Loss Since 2001
The country with the most forest loss since 2001 lost as much forest cover as the next four countries combined.
-

 Agriculture2 months ago
The World’s Top Cocoa Producing Countries
Here are the largest cocoa producing countries globally—from Côte d’Ivoire to Brazil—as cocoa prices hit record highs.


-

 Debt1 week ago
How Debt-to-GDP Ratios Have Changed Since 2000
-

 Markets2 weeks ago
Ranked: The World’s Top Flight Routes, by Revenue
-

 Demographics2 weeks ago
Population Projections: The World’s 6 Largest Countries in 2075
-

 Markets2 weeks ago
The Top 10 States by Real GDP Growth in 2023
-

 Demographics2 weeks ago
The Smallest Gender Wage Gaps in OECD Countries
-

 Economy2 weeks ago
Where U.S. Inflation Hit the Hardest in March 2024
-
Green2 weeks ago
Top Countries By Forest Growth Since 2001
-

 United States2 weeks ago
Ranked: The Largest U.S. Corporations by Number of Employees