Energy
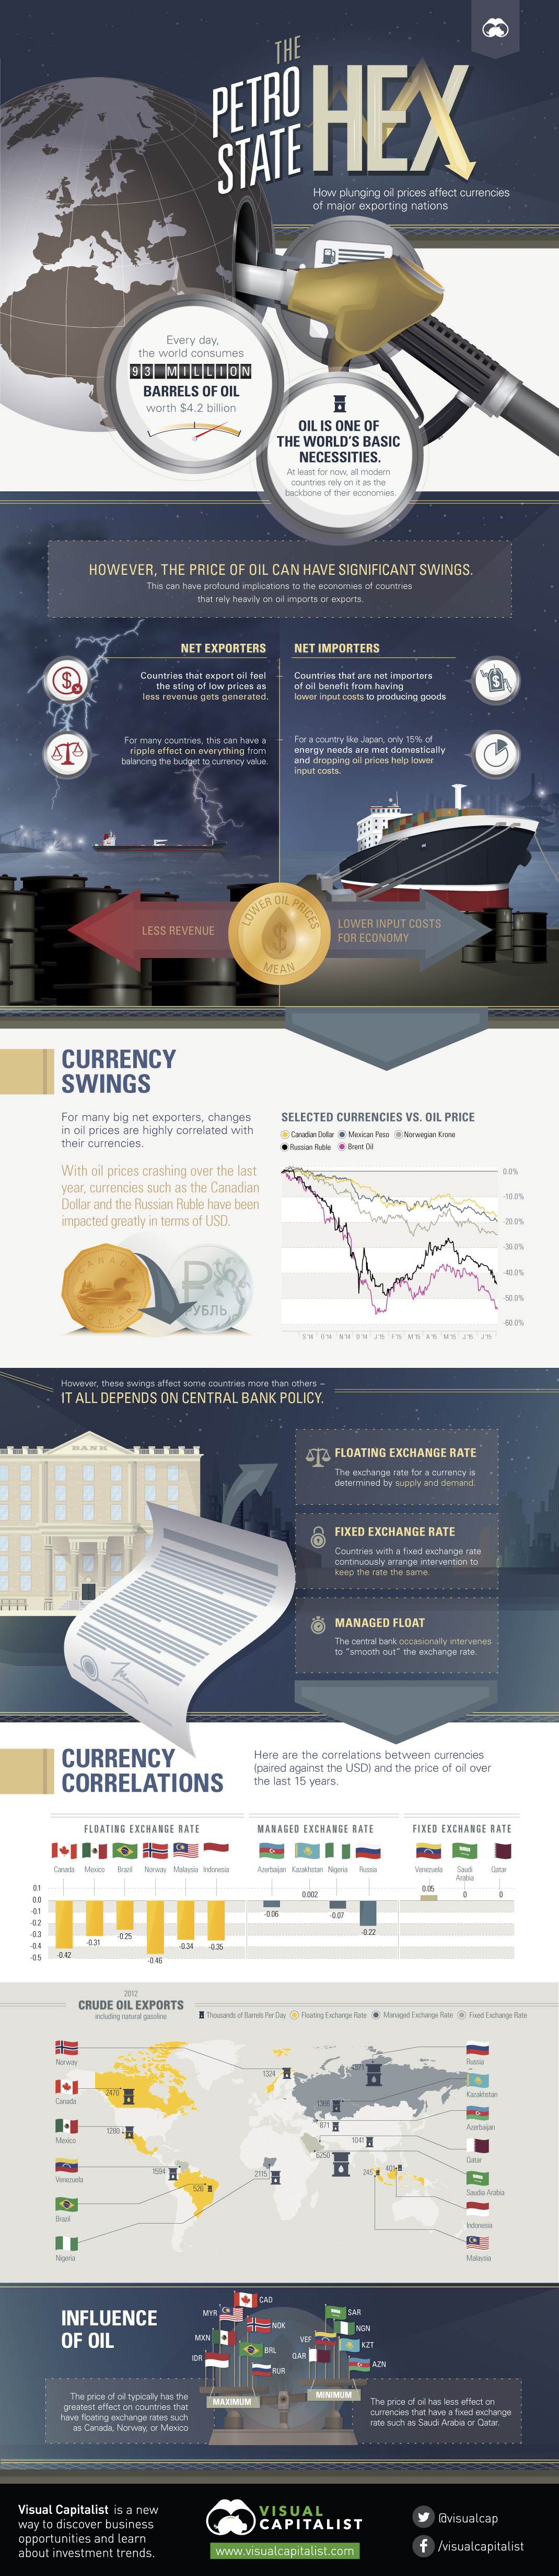
The Petrostate Hex: How Plunging Oil Prices Affect Currencies
The Petrostate Hex: How Plunging Oil Prices Affect Currencies
Every day, the world consumes 93 million barrels of oil, which is worth $4.2 billion.
Oil is one of the world’s most basic necessities. At least for now, all modern countries rely on oil and its derivatives as the backbone of their economies. However, the price of oil can have significant swings. These changes in price can have profound implications depending on whether an economy is a net importer or net exporter of crude.
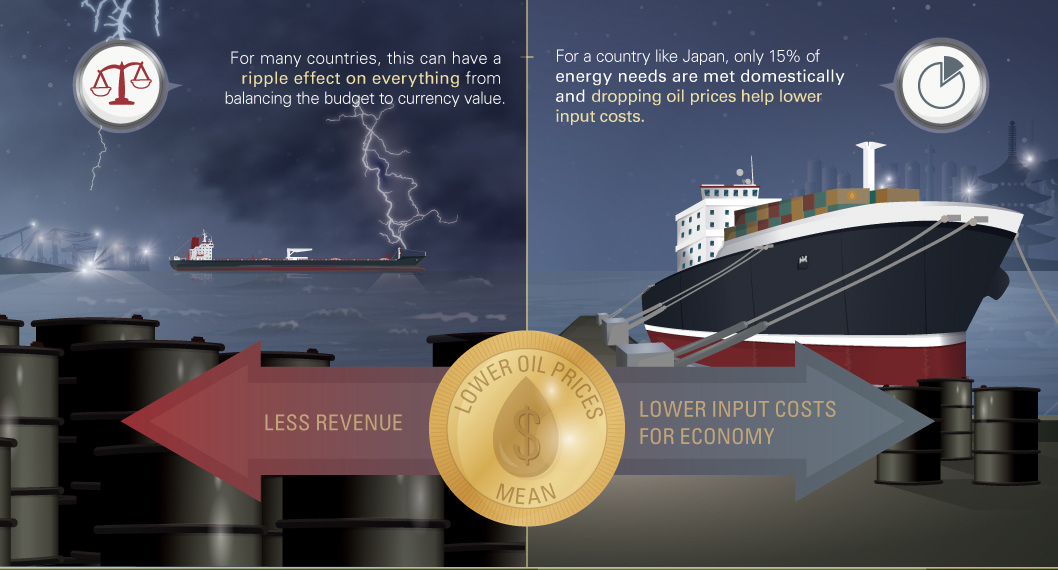
Net exporters, countries that sell more oil abroad than they bring in, feel the sting when prices plunge. Less revenue gets generated, and this can impact everything from balancing the budget to the value of their currency in the world market.
Net importers, on the other hand, benefit from lower prices as it decreases input costs for production. For example, a country like Japan only meets 15% of its energy needs domestically, and must import 3.5 million barrels of oil each day. A lower oil price significantly decreases these costs.
Currency Swings
For many major net exporters of oil, changes in oil prices are highly correlated with their currencies. With oil prices crashing over the last year, currencies such as the Canadian dollar and Russian ruble have been highly impacted in terms of USD.
For example, the ruble is down over 40% since the price of oil began to crash in 2014. With a breakeven cost of $105/bbl, the dropping price of crude as well as dwindling ruble have sent ripples through the Russian economy.
Central Bank Policy
The impact of oil on currency depends on how central banks approach policy:
Floating exchange rate: The exchange rate is determined by supply and demand.
Fixed exchange rate: Countries with fixed exchange rates continuously arrange intervention to keep the rate the same.
Managed float: The central bank occasionally intervenes to “smooth out” the exchange rate.
Currency Correlations
The price of oil typically has the largest effect on countries with floating exchange rates such as Canada, Norway, or Mexico. Over the last 15 years, the loonie (-0.42), krone (-0.46), and peso (-0.31) have all had large negative correlations in exchange rates (paired with USD) against the price of oil.
Meanwhile, countries that have pegged their rate tend to feel the impact of oil price swings elsewhere in their economy. This is because such countries have to buy or sell currencies on the open market to maintain the currency peg. Another method that can be used is to enforce a particular exchange rate by making it illegal to trade currencies at other rates, but this can often create a black market.
As a result, countries with fixed-rate policies such as Venezuela, Saudi Arabia, and Qatar have little to no correlation in their exchange rates (paired with USD) against the price of oil.


Energy
Mapped: The Age of Energy Projects in Interconnection Queues, by State
This map shows how many energy projects are in interconnection queues by state and how long these projects have been queued up, on average.


Age of Energy Projects in Interconnection Queues, by State
This was originally posted on our Voronoi app. Download the app for free on iOS or Android and discover incredible data-driven charts from a variety of trusted sources.
By the end of 2023, more than 11,000 energy projects were in interconnection queues in the United States, waiting for a green-light from regional grid operators to proceed with construction.
This map, created in partnership with the National Public Utilities Council, maps out the average age of active energy projects in interconnection queues by state, using data from Berkeley Lab.
Interconnection Queues, Explained
Interconnection queues are lists of energy projects that have made interconnection requests to their regional grid operators. Once submitted, these requests formally initiate the impact study process that each project goes through before grid connection, forming waiting lists for approval known as interconnection queues.
In recent years, both the number and generation capacity of queued projects have surged in the United States, along with the length of time spent in queue.
According to Berkeley Lab, the amount of generation capacity entering queues each year has risen by more than 550% from 2015 to 2023, with average queue duration rising from 3 years to 5 years the same period.
As a result of the growing backlog, a large proportion of projects ultimately withdraw from queues, leading to only 19% of applications reaching commercial operations.
The Backlog: Number of Projects and Average Wait Times
Of the 11,000 active projects in U.S. queues at the end of 2023, Texas, California, and Virginia had the most in queue; 1,208, 947, and 743, respectively.
When looking at the average ages of these projects, all three states hovered around the national average of 34 months (2.83 years), with Texas sporting 28 months, California 33, and Virginia 34.
Vermont, Minnesota, Wisconsin, and Florida, on the other hand, had the highest average queue durations; 54, 49, 47, and 46 months, respectively.
Average Queue Duration by Project Type
At the end of 2023, more than 95% of the generation capacity in active interconnection queues was for emission-free resources. The table below provides a breakdown.
| Project Type | Average Queue Duration (As of 12/31/2023) | Number of Projects in Queue |
|---|---|---|
| Wind | 40 months | 841 |
| Solar | 34 months | 4,506 |
| Wind+Battery | 34 months | 76 |
| Solar+Battery | 27 months | 2,377 |
| Battery | 24 months | 2,818 |
Wind projects had the highest wait times at the end of 2023 with an average age of 40 months (3.33 years). Solar projects, on the other hand, made up more than 40% of projects in queue.
Overall, reducing the time that these renewable energy projects spend in queues can accelerate the transition to a low-carbon energy future.
According to the U.S. Department of Energy, enhancing data transparency, streamlining approval processes, promoting economic efficiency, and maintaining a reliable grid are some of the ways this growing backlog can be mitigated.

-

 Culture7 days ago
The World’s Top Media Franchises by All-Time Revenue
-

 Science2 weeks ago
Visualizing the Average Lifespans of Mammals
-

 Brands2 weeks ago
How Tech Logos Have Evolved Over Time
-

 Energy2 weeks ago
Ranked: The Top 10 EV Battery Manufacturers in 2023
-

 Countries2 weeks ago
Countries With the Largest Happiness Gains Since 2010
-

 Economy2 weeks ago
VC+: Get Our Key Takeaways From the IMF’s World Economic Outlook
-

 Demographics2 weeks ago
The Countries That Have Become Sadder Since 2010
-

 Money1 week ago
Charted: Who Has Savings in This Economy?