Gold
The History of Money in America: From Beads to Virtual Currency
The first settlers in Pre-Revolutionary America were faced with a problem. There was a shortage of money in the colonies, and England prohibited settlers from minting their own coinage.
To get around this, settlers used established foreign currencies such Dutch guilders or the Spanish pieces of eight. They also began to adopt the traditional trading methods of Native Americans, who had been exchanging goods for hundreds of years before the arrival of the Europeans.
Wampum as a Currency
Wampum, or beads that were strung together, was often used as a medium of exchange for both Native American tribes and settlers during this Pre-Revolutionary era. Other commodities were also used for trade: furs, tobacco, wheat, and maize were all currencies of exchange.
As an interesting side note, wampum had tremendous inflation issues. Some tribes, such as the Narragansetts, were better at producing the beads than others. Many settlers also started comprehensive wampum manufacturing operations, and the beads were created at such a rate that they began to lose value in trade quickly.
Where does the storied history of money in the United States go from here? Today’s infographic highlights many interesting aspects of it, moving from beads all the way to virtual currency:
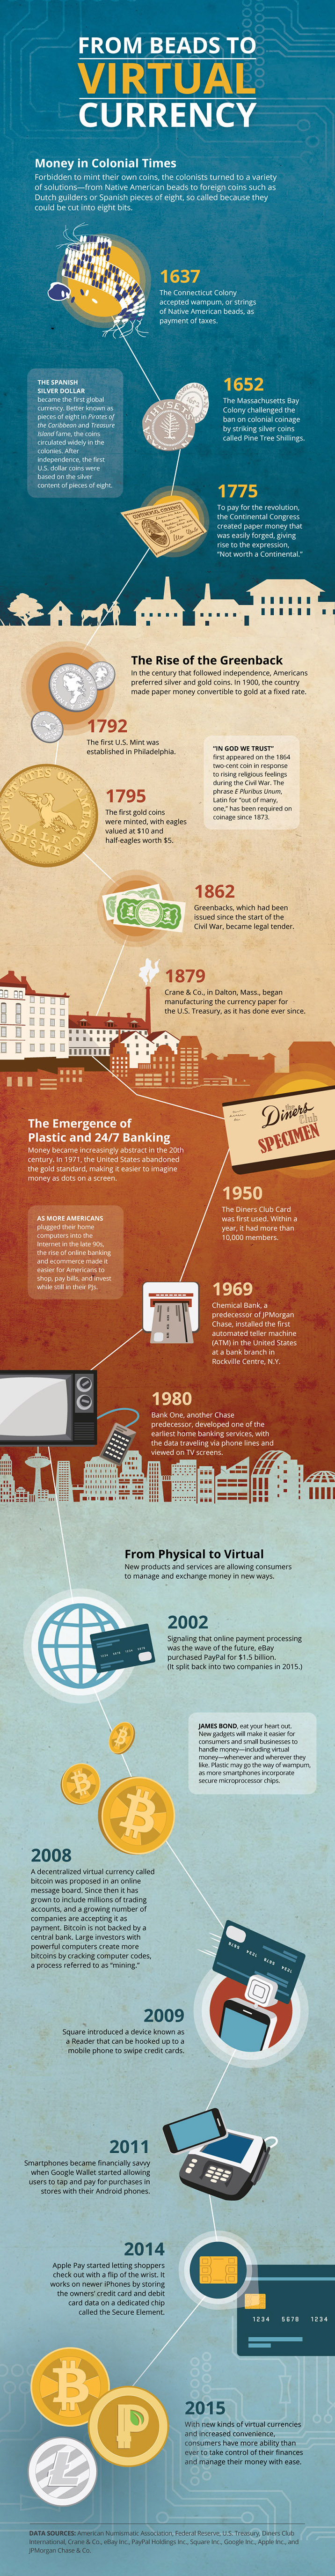
Image courtesy of: JPMorgan Chase
In the modern era, the concept of “money” is changing right before our eyes.
Throughout most of the history of money, it has been a tactile thing. Whether we’re talking about strange currencies such as cacao beans or wampum beads that were traded in the past, or we’re looking at more modern concepts of coinage, money has traditionally been something physical. Bank accounts, cheques, credit cards, and future digital technologies would eventually rise to prominence, making money much more abstract.
Today, everything is digital in nature.
With a few clicks, money can be created or moved around. Bitcoin and the blockchain ecosystem have evolved as new technologies that may also have a significant impact on the future of money.
The history of money in America, and the world, is constantly changing. It’s beautiful and scary all at the same time.
Original graphic by: JPMorgan Chase


Mining
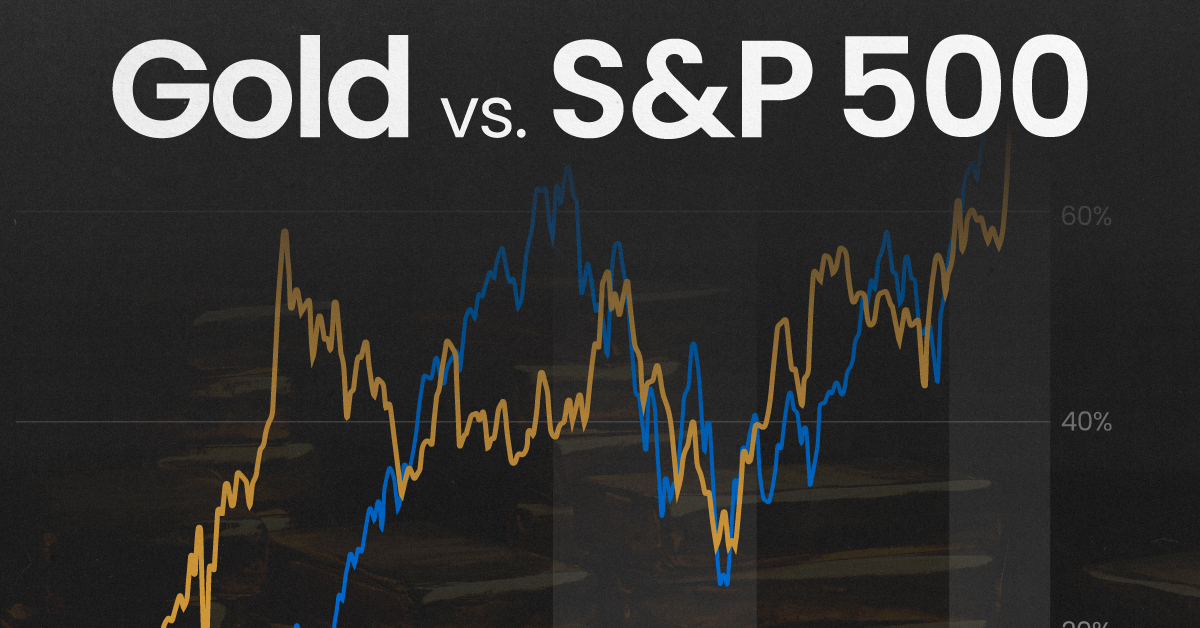
Gold vs. S&P 500: Which Has Grown More Over Five Years?
The price of gold has set record highs in 2024, but how has this precious metal performed relative to the S&P 500?

Gold vs. S&P 500: Which Has Grown More Over Five Years?
This was originally posted on our Voronoi app. Download the app for free on Apple or Android and discover incredible data-driven charts from a variety of trusted sources.
Gold is considered a unique asset due to its enduring value, historical significance, and application in various technologies like computers, spacecraft, and communications equipment.
Commonly regarded as a “safe haven asset”, gold is something investors typically buy to protect themselves during periods of global uncertainty and economic decline.
It is for this reason that gold has performed rather strongly in recent years, and especially in 2024. Persistent inflation combined with multiple wars has driven up demand for gold, helping it set a new all-time high of over $2,400 per ounce.
To put this into perspective, we visualized the performance of gold alongside the S&P 500. See the table below for performance figures as of April 12, 2024.
| Asset/Index | 1 Yr (%) | 5 Yr (%) |
|---|---|---|
| 🏆 Gold | +16.35 | +81.65 |
| 💼 S&P 500 | +25.21 | +76.22 |
Over the five-year period, gold has climbed an impressive 81.65%, outpacing even the S&P 500.
Get Your Gold at Costco
Perhaps a sign of how high the demand for gold is becoming, wholesale giant Costco is reportedly selling up to $200 million worth of gold bars every month in the United States. The year prior, sales only amounted to $100 million per quarter.
Consumers aren’t the only ones buying gold, either. Central banks around the world have been accumulating gold in very large quantities, likely as a hedge against inflation.
According to the World Gold Council, these institutions bought 1,136 metric tons in 2022, marking the highest level since 1950. Figures for 2023 came in at 1,037 metric tons.
See More Graphics on Gold
If you’re fascinated by gold, be sure to check out more Visual Capitalist content including 200 Years of Global Gold Production, by Country or Ranked: The Largest Gold Reserves by Country.

-

 Education1 week ago
How Hard Is It to Get Into an Ivy League School?
-

 Technology2 weeks ago
Ranked: Semiconductor Companies by Industry Revenue Share
-

 Markets2 weeks ago
Ranked: The World’s Top Flight Routes, by Revenue
-

 Demographics2 weeks ago
Population Projections: The World’s 6 Largest Countries in 2075
-

 Markets2 weeks ago
The Top 10 States by Real GDP Growth in 2023
-

 Demographics2 weeks ago
The Smallest Gender Wage Gaps in OECD Countries
-

 Economy2 weeks ago
Where U.S. Inflation Hit the Hardest in March 2024
-

 Green2 weeks ago
Top Countries By Forest Growth Since 2001