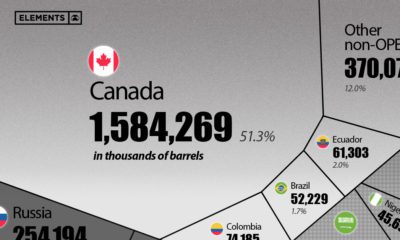

This visualization breaks down U.S. oil imports by country for 2021, showing the split by OPEC and non-OPEC nations.
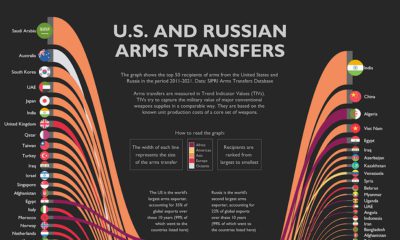

The U.S. and Russia combined for 57% of all global arms transfers in the last decade. This graphic highlights their 50 biggest trade partners.
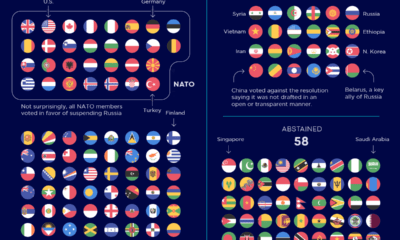

Here's how the global community voted on the resolution: In favor - 93 | Abstained - 58 | Against - 24
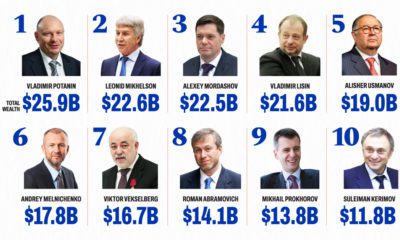

Russian billionaires have lost more than $38 billion in 2022 because of Western sanctions on Russia in reprisal for the invasion of Ukraine.
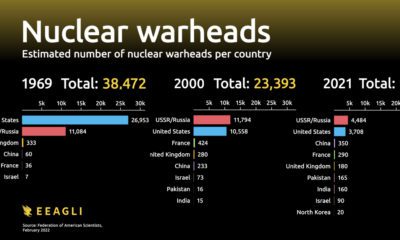

Nine countries currently possess all the world's nuclear warheads. This animation visualizes how the global nuclear arsenal has changed since 1945.
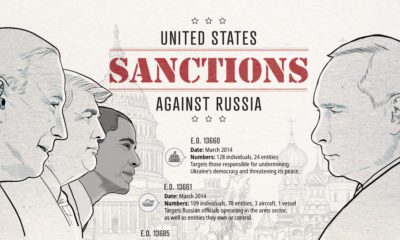

Russia faces a multitude of U.S. sanctions for its participation in global conflicts. This infographic lists who and what has been impacted.
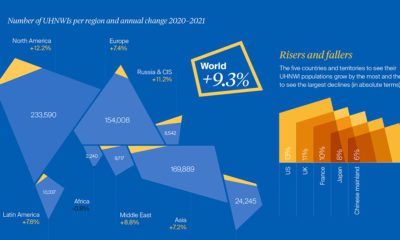

The global pool of ultra-high-net-worth individuals (UHNWI) has skyrocketed 75% in five years. In 2021 alone, it jumped 9.3%.
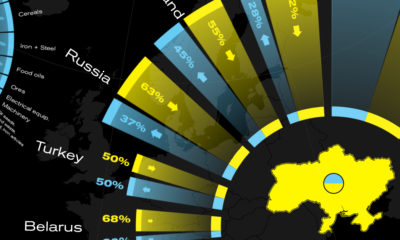

This graphic visualizes Ukraine's top international trading partners and the country's most exported and imported products in 2020.
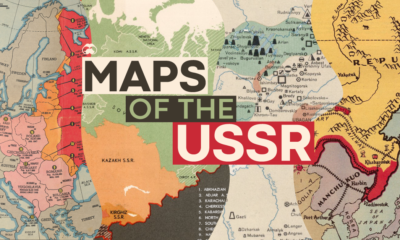

These historical maps tell the story of the USSR, and how its territorial expansion and contraction is linked to present day geopolitical events.
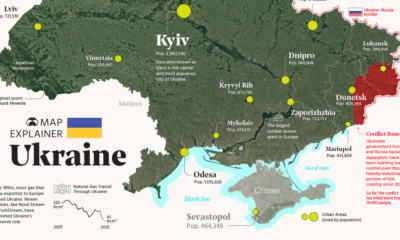

Ukraine has made the headlines due to the ongoing tensions with Russia. In this map infographic, we examine Ukraine from a structural point of view.


 Creator Program