

What does a road map of the world look like? Here’s a deep view of roads visualized by type across countries and continents.
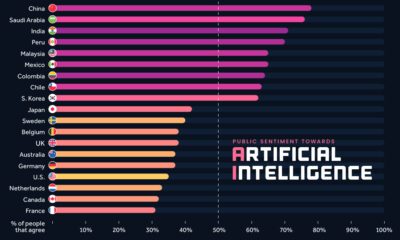

We visualize survey results from over 19,000 adults across 28 countries to see how attitudes towards AI differ around the world.
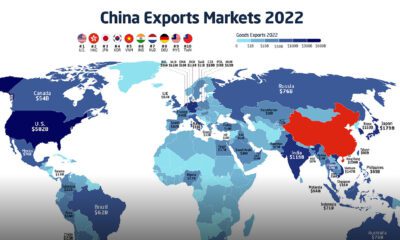

In 2022, China exported $3.6 trillion of goods, more than the GDP of the UK or India. Here's how Chinese exports have evolved since 2001.
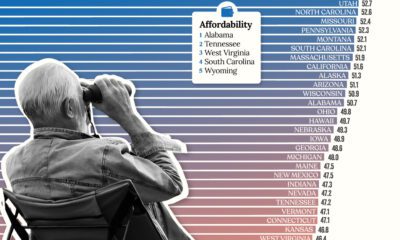

Getting ready for retirement? See which states score the highest in terms of affordability, quality of life, and health care.
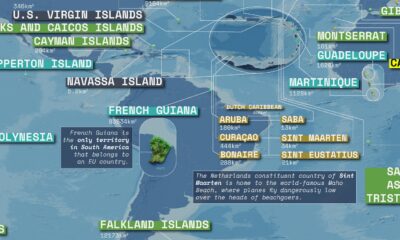

This massive map highlights overseas territories and dependencies around the world and their sovereign states.
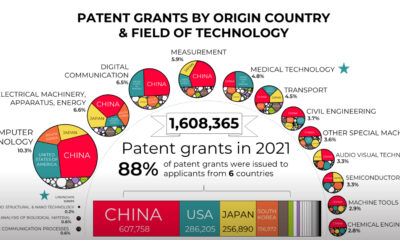

Which countries, and technologies, are being granted the most new patents? This graphic visualizes patent grants by country of origin.
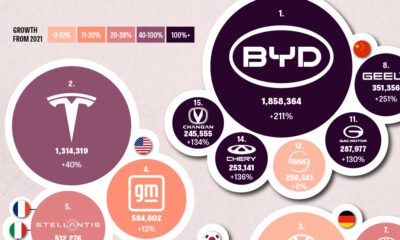

This graphic explores the latest EV production data for 2022, which shows BYD taking a massive step forward to surpass Tesla.


In this graphic we explore the world’s declining fertility rate over the last 60 years and the disparity in fertility rates between nations
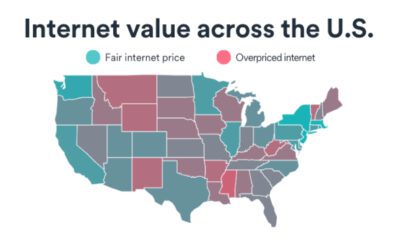

Which U.S. state has the best internet value? Browse this interactive map to see where states rank on the Internet Value Index.


This infographic examines 50 years of data to highlight a clear visual trend: recessions are preceded by a cyclical low in unemployment.


 Creator Program