Personal Finance
Ranked: The Best U.S. States for Retirement


Ranked: The Best U.S. States for Retirement
What is the most important aspect of retirement planning?
If you said finances, you’re probably right. But have you ever thought about where the best place is to retire? Being strategic about location can make a big impact on your quality of life, and perhaps help your savings go just a bit further.
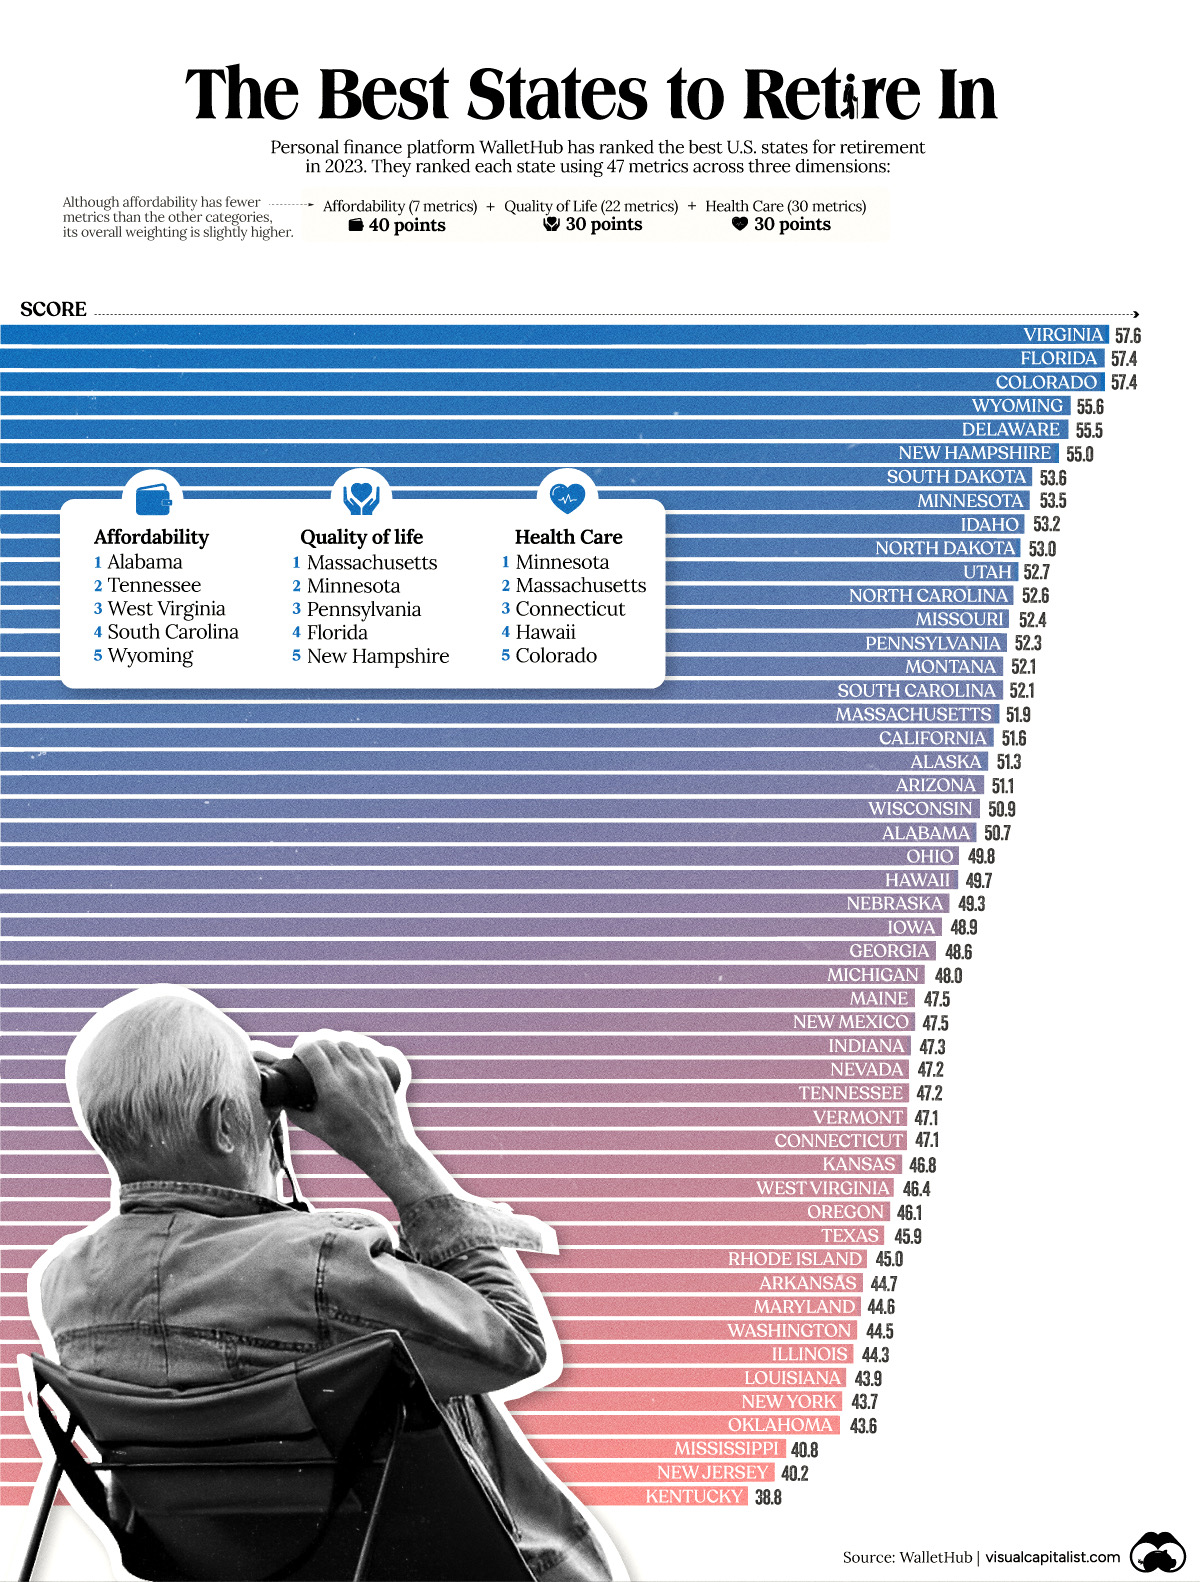
To help break it down, we’ve visualized data from personal finance platform, WalletHub, which ranked the best U.S. states for retirement as of 2023.
Data and Methodology
WalletHub ranked each state using 47 metrics across three dimensions.
- Affordability (7 metrics worth 40 points)
- Quality of Life (22 metrics worth 30 points)
- Health Care (18 metrics worth 30 points)
Here are some examples of what each dimension measures:
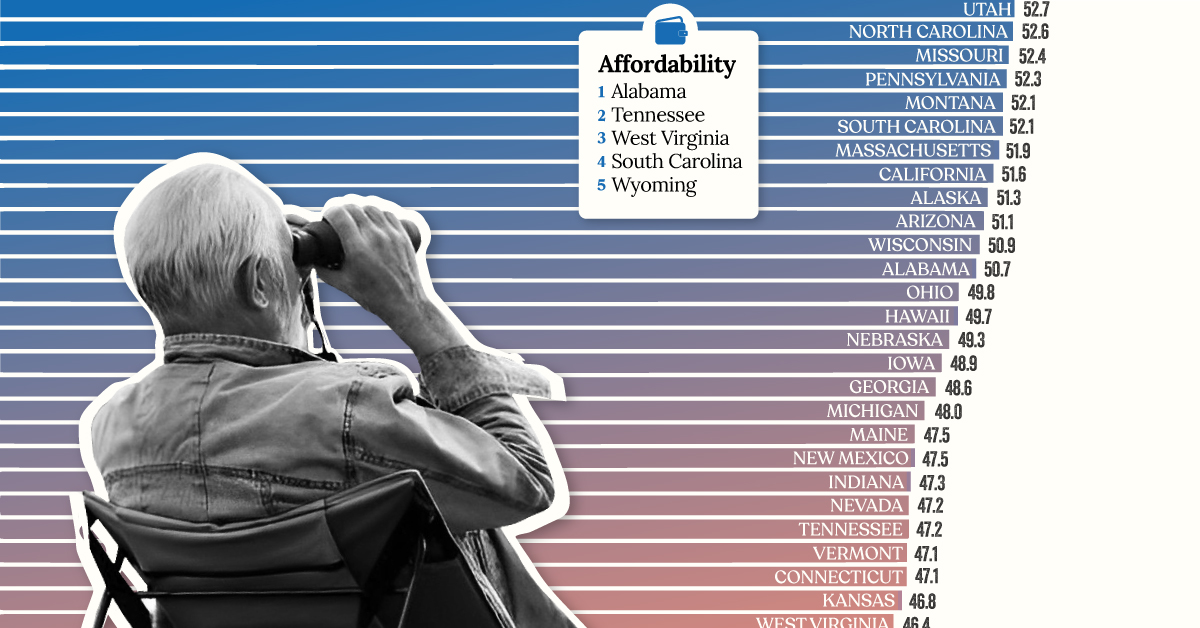
- Affordability: Cost of living and taxation
- Quality of Life: Quality of elder-abuse protections and crime rates
- Health Care: Number of health professionals per capita and life expectancy
Visit the source for the full list of metrics.
The final scores (visualized as the bars in the infographic above) represent each state’s weighted average across all metrics. See below for more comprehensive results.
| Rank | State | Score | Affordability (rank) | Quality of Life (rank) | Health Care (rank) |
|---|---|---|---|---|---|
| 1 | Virginia | 57.6 | 16 | 11 | 11 |
| 2T | Florida | 57.4 | 9 | 4 | 28 |
| 2T | Colorado | 57.4 | 14 | 27 | 5 |
| 4 | Wyoming | 55.6 | 5 | 9 | 38 |
| 5 | Delaware | 55.5 | 6 | 33 | 18 |
| 6 | New Hampshire | 55.0 | 31 | 5 | 7 |
| 7 | South Dakota | 53.6 | 25 | 30 | 9 |
| 8 | Minnesota | 53.5 | 40 | 2 | 1 |
| 9 | Idaho | 53.2 | 15 | 17 | 31 |
| 10 | North Dakota | 53.0 | 22 | 25 | 20 |
| 11 | Utah | 52.7 | 20 | 24 | 26 |
| 12 | North Carolina | 52.6 | 12 | 23 | 35 |
| 13 | Missouri | 52.4 | 17 | 28 | 32 |
| 14 | Pennsylvania | 52.3 | 36 | 3 | 12 |
| 15T | Montana | 52.1 | 24 | 15 | 29 |
| 15T | South Carolina | 52.1 | 4 | 38 | 39 |
| 17 | Massachusetts | 51.9 | 47 | 1 | 2 |
| 18 | California | 51.6 | 32 | 19 | 10 |
| 19 | Alaska | 51.3 | 26 | 36 | 8 |
| 20 | Arizona | 51.1 | 18 | 35 | 25 |
| 21 | Wisconsin | 50.9 | 34 | 14 | 17 |
| 22 | Alabama | 50.7 | 1 | 44 | 50 |
| 23 | Ohio | 49.8 | 27 | 8 | 37 |
| 24 | Hawaii | 49.7 | 38 | 29 | 4 |
| 25 | Nebraska | 49.3 | 37 | 16 | 15 |
| 26 | Iowa | 48.9 | 35 | 12 | 24 |
| 27 | Georgia | 48.6 | 7 | 40 | 42 |
| 28 | Michigan | 48.0 | 29 | 18 | 36 |
| 29T | Maine | 47.5 | 43 | 6 | 13 |
| 29T | New Mexico | 47.5 | 21 | 46 | 30 |
| 31 | Indiana | 47.3 | 23 | 31 | 40 |
| 32T | Nevada | 47.2 | 11 | 42 | 41 |
| 32T | Tennessee | 47.2 | 2 | 48 | 45 |
| 34T | Vermont | 47.1 | 48 | 7 | 6 |
| 34T | Connecticut | 47.1 | 44 | 26 | 3 |
| 36 | Kansas | 46.8 | 30 | 32 | 33 |
| 37 | West Virginia | 46.4 | 3 | 43 | 49 |
| 38 | Oregon | 46.1 | 41 | 21 | 21 |
| 39 | Texas | 45.9 | 28 | 37 | 34 |
| 40 | Rhode Island | 45.0 | 39 | 39 | 14 |
| 41 | Arkansas | 44.7 | 8 | 49 | 44 |
| 42 | Maryland | 44.6 | 46 | 20 | 19 |
| 43 | Washington | 44.5 | 45 | 13 | 23 |
| 44 | Illinois | 44.3 | 42 | 22 | 27 |
| 45 | Louisiana | 43.9 | 13 | 45 | 47 |
| 46 | New York | 43.7 | 50 | 10 | 16 |
| 47 | Oklahoma | 43.6 | 19 | 47 | 43 |
| 48 | Mississippi | 40.8 | 10 | 50 | 48 |
| 49 | New Jersey | 40.2 | 49 | 34 | 22 |
| 50 | Kentucky | 38.8 | 33 | 41 | 46 |
According to this methodology, Virginia is currently the best state for retirement. Although the Southeastern state does not excel in any one dimension, it scores consistently well across all three to create a very balanced retirement profile.
This gives it a slight advantage over second place Florida, which excels in quality of life and affordability, but falls further behind in terms of health care. Third-placed Colorado is a mirror of Florida, offering excellent health care but a lower quality of life in comparison.
How to Interpret These Results
It’s important to remember that this ranking is purely based on data and the methodology above, and may not be tailored to your individual preferences.
For example, if you believe that health services will be very important during retirement, you may rank Minnesota (#1 in terms of health care) much higher than eighth place.
You may notice that prioritizing one dimension will often come at a trade-off in others. Looking at Minnesota once more, we can see that the state is also one of America’s most expensive.
Looking to retire outside of the U.S.? Check out this graphic on the top 25 countries to retire in.


Personal Finance
Chart: The Declining Value of the U.S. Federal Minimum Wage
This graphic compares the nominal vs. inflation-adjusted value of the U.S. minimum wage, from 1940 to 2023.


The Declining Value of the U.S. Federal Minimum Wage
This was originally posted on our Voronoi app. Download the app for free on iOS or Android and discover incredible data-driven charts from a variety of trusted sources.
This graphic illustrates the history of the U.S. federal minimum wage using data compiled by Statista, in both nominal and real (inflation-adjusted) terms. The federal minimum wage was raised to $7.25 per hour in July 2009, where it has remained ever since.
Nominal vs. Real Value
The data we used to create this graphic can be found in the table below.
| Year | Nominal value ($/hour) | Real value ($/hour) |
|---|---|---|
| 1940 | 0.3 | 6.5 |
| 1945 | 0.4 | 6.82 |
| 1950 | 0.75 | 9.64 |
| 1955 | 0.75 | 8.52 |
| 1960 | 1 | 10.28 |
| 1965 | 1.25 | 12.08 |
| 1970 | 1.6 | 12.61 |
| 1975 | 2.1 | 12.04 |
| 1980 | 3.1 | 11.61 |
| 1985 | 3.35 | 9.51 |
| 1990 | 3.8 | 8.94 |
| 1995 | 4.25 | 8.49 |
| 2000 | 5.15 | 9.12 |
| 2005 | 5.15 | 8.03 |
| 2010 | 7.25 | 10.09 |
| 2015 | 7.25 | 9.3 |
| 2018 | 7.25 | 8.78 |
| 2019 | 7.25 | 8.61 |
| 2020 | 7.25 | 8.58 |
| 2021 | 7.25 | 8.24 |
| 2022 | 7.25 | 7.61 |
| 2023 | 7.25 | 7.25 |
What our graphic shows is how inflation has eroded the real value of the U.S. minimum wage over time, despite nominal increases.
For instance, consider the year 1960, when the federal minimum wage was $1 per hour. After accounting for inflation, this would be worth around $10.28 today!
The two lines converge at 2023 because the nominal and real value are identical in present day terms.
Many States Have Their Own Minimum Wage
According to the National Conference of State Legislatures (NCSL), 30 states and Washington, D.C. have implemented a minimum wage that is higher than $7.25.
The following states have adopted the federal minimum: Georgia, Idaho, Indiana, Iowa, Kansas, Kentucky, New Hampshire, North Carolina, North Dakota, Oklahoma, Pennsylvania, Texas, Utah, Wisconsin, and Wyoming.
Meanwhile, the states of Alabama, Louisiana, Mississippi, South Carolina, and Tennessee have no wage minimums, but have to follow the federal minimum.
How Does the U.S. Minimum Wage Rank Globally?
If you found this topic interesting, check out Mapped: Minimum Wage Around the World to see which countries have the highest minimum wage in monthly terms, as of January 2023.

-

 Misc1 week ago
How Hard Is It to Get Into an Ivy League School?
-

 Technology2 weeks ago
Ranked: Semiconductor Companies by Industry Revenue Share
-

 Markets2 weeks ago
Ranked: The World’s Top Flight Routes, by Revenue
-

 Countries2 weeks ago
Population Projections: The World’s 6 Largest Countries in 2075
-

 Markets2 weeks ago
The Top 10 States by Real GDP Growth in 2023
-

 Demographics2 weeks ago
The Smallest Gender Wage Gaps in OECD Countries
-

 Economy2 weeks ago
Where U.S. Inflation Hit the Hardest in March 2024
-

 Green2 weeks ago
Top Countries By Forest Growth Since 2001