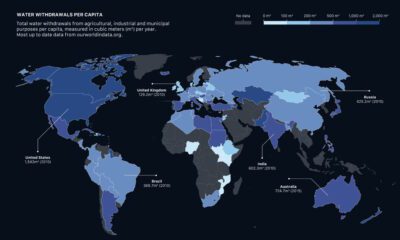

How much water do we have, and which countries use the most? This visual breaks down global water distribution and withdrawals by countries.
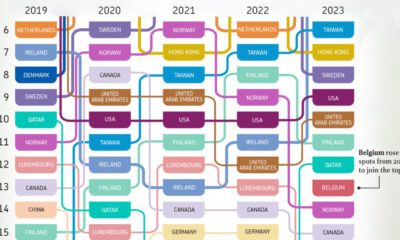

What are the most competitive countries when it comes to business? This visual highlights the top 20 economies over the last five years.
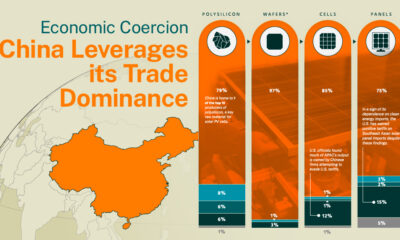

The Hinrich Foundation explores China's use of economic coercion and the implications of its control over the solar energy sector.
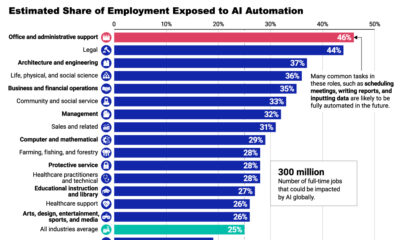

AI automation is expected to impact some industries more than others. See the latest projections in this infographic.


Which companies prioritize innovation the most? This infographic highlights BCG's 2023 Most Innovative Companies ranking.


This graphic visualizes the market capitalizations of America's 15 largest semiconductor companies.
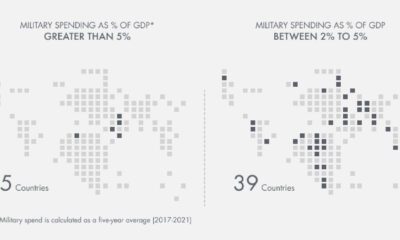

Which countries have the highest military spend relative to their economy? This visual breaks down the amount spent in each country by GDP.
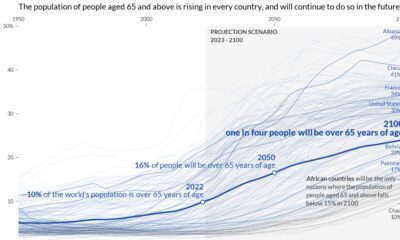

This graphic visualizes the world’s aging population, showing data for every country and territory around the world.
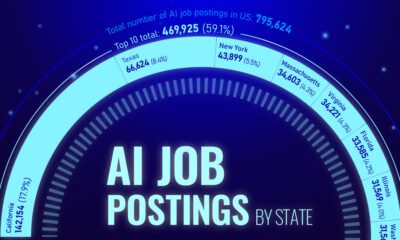

Nearly 800,000 AI jobs were posted in the U.S. throughout 2022. View this graphic to see a breakdown by state.
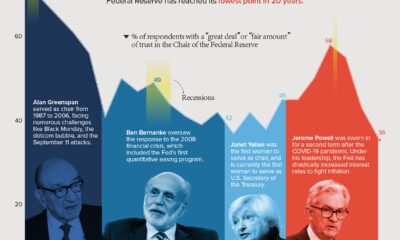

Public trust in the Federal Reserve chair has hit its lowest point in 20 years. Get the details in this infographic.


 Creator Program