Technology
Visualizing the Top U.S. States for AI Jobs


Visualizing the Top U.S. States for AI Jobs
Much ink has been spilled over fears that artificial intelligence (AI) will eliminate jobs in the economy. While some of those fears may be well-founded, red-hot interest in AI innovation is creating new jobs as well.
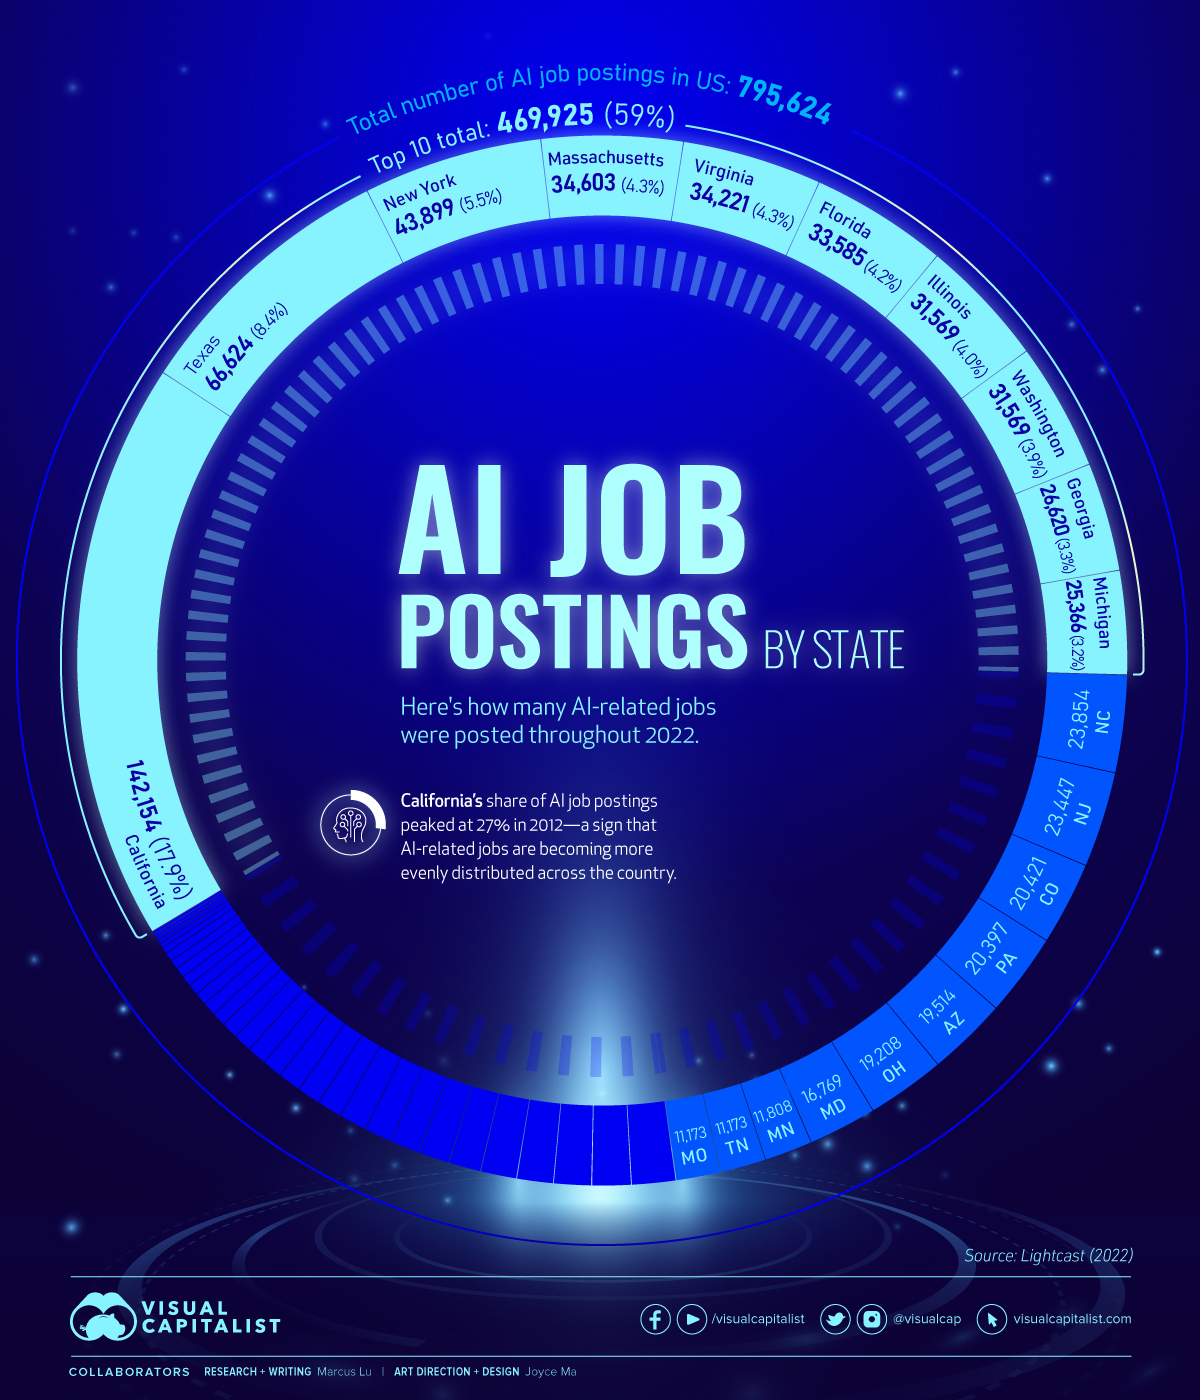
This graphic visualizes data from Lightcast, a labor market analytics firm, which shows how many AI-related jobs were posted in each state throughout 2022.
In total there were 795,624 AI jobs posted throughout the year, of which 469,925 (59%) were in the top 10. The full tally is included in the table below.
| Rank | State | Number of job postings | % of total |
|---|---|---|---|
| 1 | California | 142,154 | 17.9% |
| 2 | Texas | 66,624 | 8.4% |
| 3 | New York | 43,899 | 5.5% |
| 4 | Massachusetts | 34,603 | 4.3% |
| 5 | Virginia | 34,221 | 4.3% |
| 6 | Florida | 33,585 | 4.2% |
| 7 | Illinois | 31,569 | 4.0% |
| 8 | Washington | 31,284 | 3.9% |
| 9 | Georgia | 26,620 | 3.3% |
| 10 | Michigan | 25,366 | 3.2% |
| 11 | North Carolina | 23,854 | 3.0% |
| 12 | New Jersey | 23,447 | 2.9% |
| 13 | Colorado | 20,421 | 2.6% |
| 14 | Pennsylvania | 20,397 | 2.6% |
| 15 | Arizona | 19,514 | 2.5% |
| 16 | Ohio | 19,208 | 2.4% |
| 17 | Maryland | 16,769 | 2.1% |
| 18 | Minnesota | 11,808 | 1.5% |
| 19 | Tennessee | 11,173 | 1.4% |
| 20 | Missouri | 10,990 | 1.4% |
| 21 | Oregon | 10,811 | 1.4% |
| 22 | Washington, D.C. | 9,606 | 1.2% |
| 23 | Indiana | 9,247 | 1.2% |
| 24 | Connecticut | 8,960 | 1.1% |
| 25 | Wisconsin | 8,879 | 1.1% |
| 26 | Alabama | 7,866 | 1.0% |
| 27 | Kansas | 7,683 | 1.0% |
| 28 | Arkansas | 7,247 | 0.9% |
| 29 | Utah | 6,885 | 0.9% |
| 30 | Nevada | 6,813 | 0.9% |
| 31 | Idaho | 6,109 | 0.8% |
| 32 | Oklahoma | 5,719 | 0.7% |
| 33 | Iowa | 5,670 | 0.7% |
| 34 | South Carolina | 4,928 | 0.6% |
| 35 | Louisiana | 4,806 | 0.6% |
| 36 | Kentucky | 4,536 | 0.6% |
| 37 | Nebraska | 4,032 | 0.5% |
| 38 | Delaware | 3,503 | 0.4% |
| 39 | New Mexico | 3,357 | 0.4% |
| 40 | Rhode Island | 2,965 | 0.4% |
| 41 | New Hampshire | 2,719 | 0.3% |
| 42 | Hawaii | 2,550 | 0.3% |
| 43 | Mississippi | 2,548 | 0.3% |
| 44 | Maine | 2,227 | 0.3% |
| 45 | South Dakota | 2,195 | 0.3% |
| 46 | Vermont | 1,571 | 0.2% |
| 47 | North Dakota | 1,227 | 0.2% |
| 48 | Alaska | 970 | 0.1% |
| 49 | West Virginia | 887 | 0.1% |
| 50 | Montana | 833 | 0.1% |
| 51 | Wyoming | 769 | 0.1% |
The following chart adds some context to these numbers. It shows how the percentage of AI job postings in some of the top states has changed since 2010.
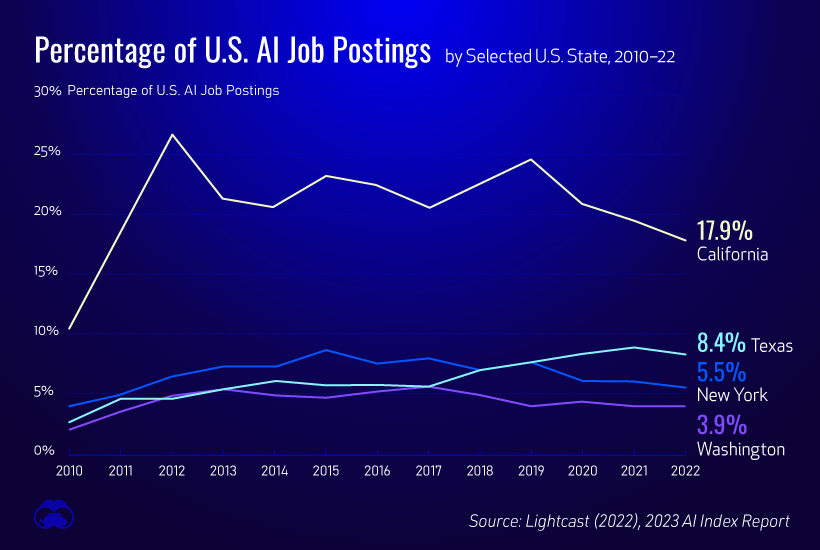
We can see that California quickly became the primary destination for AI jobs in the early 2010s, presumably as Silicon Valley companies began developing the technology.
California’s share has since declined, with a significant number of jobs seemingly moving to Texas. In fact, many tech companies are relocating to Texas to avoid California’s relatively higher taxes and cost of living.
The 10 Most In-Demand Specialized Skills
Lightcast also captured the top 10 specialized skills that were required for AI-related jobs. These are listed in the table below.
| Skill | Frequency (number of postings) | Frequency (% of postings) |
|---|---|---|
| Python | 296,662 | 37% |
| Computer Science | 260,333 | 33% |
| SQL | 185,807 | 23% |
| Data Analysis | 159,801 | 20% |
| Data Science | 157,855 | 20% |
| Amazon Web Services | 155,615 | 19% |
| Agile Methodology | 152,965 | 19% |
| Automation | 138,791 | 17% |
| Java | 133,856 | 17% |
| Software Engineering | 133,286 | 17% |
If you’re interested in a career that focuses on AI, becoming proficient in Python is likely to be a good first step.


Technology
All of the Grants Given by the U.S. CHIPS Act
Intel, TSMC, and more have received billions in subsidies from the U.S. CHIPS Act in 2024.


All of the Grants Given by the U.S. CHIPS Act
This was originally posted on our Voronoi app. Download the app for free on iOS or Android and discover incredible data-driven charts from a variety of trusted sources.
This visualization shows which companies are receiving grants from the U.S. CHIPS Act, as of April 25, 2024. The CHIPS Act is a federal statute signed into law by President Joe Biden that authorizes $280 billion in new funding to boost domestic research and manufacturing of semiconductors.
The grant amounts visualized in this graphic are intended to accelerate the production of semiconductor fabrication plants (fabs) across the United States.
Data and Company Highlights
The figures we used to create this graphic were collected from a variety of public news sources. The Semiconductor Industry Association (SIA) also maintains a tracker for CHIPS Act recipients, though at the time of writing it does not have the latest details for Micron.
| Company | Federal Grant Amount | Anticipated Investment From Company |
|---|---|---|
| 🇺🇸 Intel | $8,500,000,000 | $100,000,000,000 |
| 🇹🇼 TSMC | $6,600,000,000 | $65,000,000,000 |
| 🇰🇷 Samsung | $6,400,000,000 | $45,000,000,000 |
| 🇺🇸 Micron | $6,100,000,000 | $50,000,000,000 |
| 🇺🇸 GlobalFoundries | $1,500,000,000 | $12,000,000,000 |
| 🇺🇸 Microchip | $162,000,000 | N/A |
| 🇬🇧 BAE Systems | $35,000,000 | N/A |
BAE Systems was not included in the graphic due to size limitations
Intel’s Massive Plans
Intel is receiving the largest share of the pie, with $8.5 billion in grants (plus an additional $11 billion in government loans). This grant accounts for 22% of the CHIPS Act’s total subsidies for chip production.
From Intel’s side, the company is expected to invest $100 billion to construct new fabs in Arizona and Ohio, while modernizing and/or expanding existing fabs in Oregon and New Mexico. Intel could also claim another $25 billion in credits through the U.S. Treasury Department’s Investment Tax Credit.
TSMC Expands its U.S. Presence
TSMC, the world’s largest semiconductor foundry company, is receiving a hefty $6.6 billion to construct a new chip plant with three fabs in Arizona. The Taiwanese chipmaker is expected to invest $65 billion into the project.
The plant’s first fab will be up and running in the first half of 2025, leveraging 4 nm (nanometer) technology. According to TrendForce, the other fabs will produce chips on more advanced 3 nm and 2 nm processes.
The Latest Grant Goes to Micron
Micron, the only U.S.-based manufacturer of memory chips, is set to receive $6.1 billion in grants to support its plans of investing $50 billion through 2030. This investment will be used to construct new fabs in Idaho and New York.

-

 Misc1 week ago
How Hard Is It to Get Into an Ivy League School?
-

 Technology2 weeks ago
Ranked: Semiconductor Companies by Industry Revenue Share
-

 Markets2 weeks ago
Ranked: The World’s Top Flight Routes, by Revenue
-

 Countries2 weeks ago
Population Projections: The World’s 6 Largest Countries in 2075
-

 Markets2 weeks ago
The Top 10 States by Real GDP Growth in 2023
-

 Demographics2 weeks ago
The Smallest Gender Wage Gaps in OECD Countries
-

 Economy2 weeks ago
Where U.S. Inflation Hit the Hardest in March 2024
-

 Green2 weeks ago
Top Countries By Forest Growth Since 2001