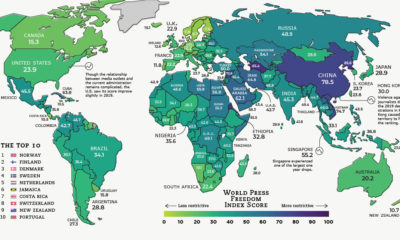

Global press freedom improved slightly in 2019, but censorship, intimidation, and violence remain a fact of life for many journalists around the world.
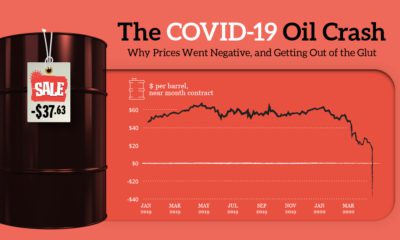

How oil prices went negative: this explainer shows how a collapse in demand, a Saudi-Russia price war, and oversupply led to futures prices going wonky.
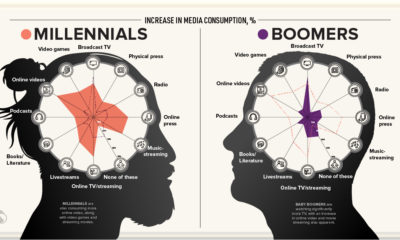

This visualization explores how each generation's media consumption is changing amid the frenzy of pandemic-induced quarantines.
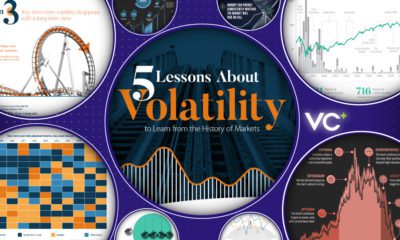

This month on VC+: an in-depth roundup on investor psychology, a behind the scenes look at making our new book, and of course, The Trendline.
With so much misinformation spreading on the pandemic, we've compiled a quality list of data-driven and unbiased COVID-19 resources for you to use.
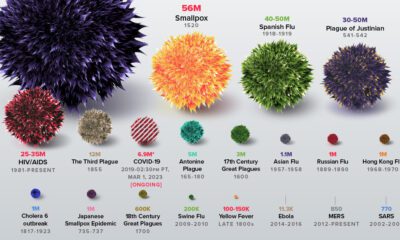

The history of pandemics, from the Antonine Plague to the novel coronavirus (COVID-19) event, ranked by their impact on human life.

Thanks to overwhelming support from our audience, our new book is a go!
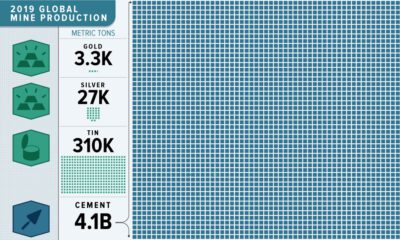

This massive infographic reveals the dramatic scale of 2019 non-fuel mineral global production.
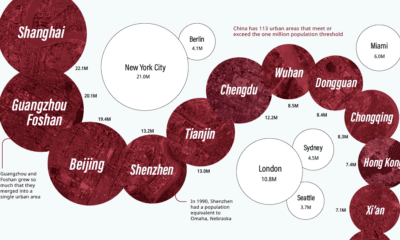

China has the same amount of 1 million+ population cities as both North America and the EU combined. Here they all are, from biggest to smallest.
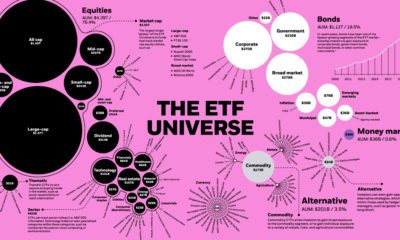

The global ETF universe has grown to be worth $5.75 trillion — here's how the assets break down by type, sector, and investment focus.


