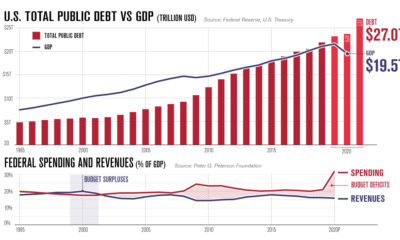

America's debt recently surpassed $27 trillion. In this infographic, we peel back the layers to understand why it keeps on growing.


This graphic highlights the top product searches on Amazon in the U.S., providing a glimpse of what items American consumers are after.
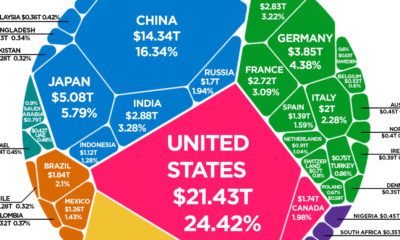

The world's total GDP crested $88 trillion in 2019—but how are the current COVID-19 economic contractions affecting its future outlook?
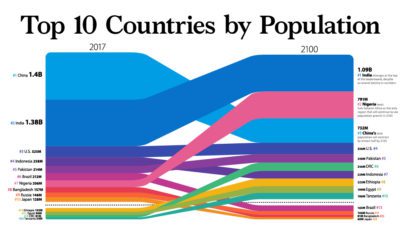

New estimates show that world population may begin shrinking in coming years. We visualize this and how country populations will change by 2100.
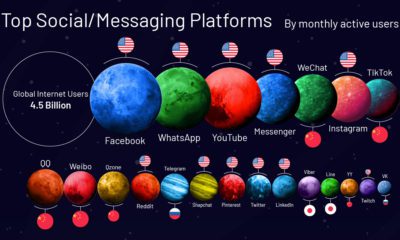

Nearly half the world has tapped into the social media universe. Monthly Active Users (MAUs) quantifies the success of these giant platforms.
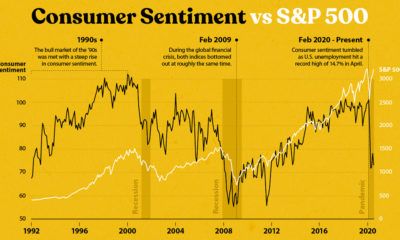

Consumer sentiment has dropped significantly since the emergence of COVID-19, but why haven't stock markets seemed to notice?
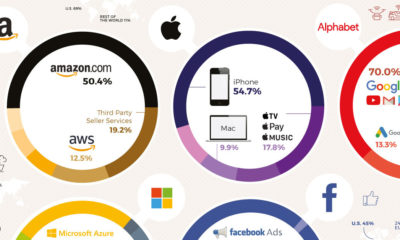

The big five tech companies generate almost $900 billion in revenues combined, more than the GDP of four of the G20 nations. Here's how they earn...
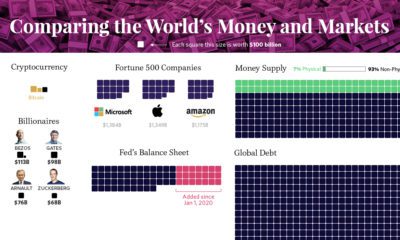

Our most famous visualization, updated for 2020 to show all global debt, wealth, money, and assets in one massive and mind-bending chart.
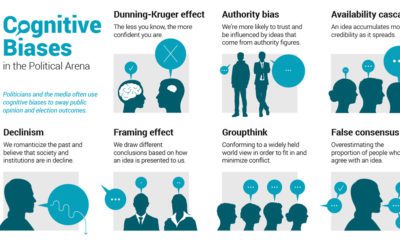

Humans are hardwired to make mental mistakes called cognitive biases. Here are common biases that can shape political opinion, and even elections.
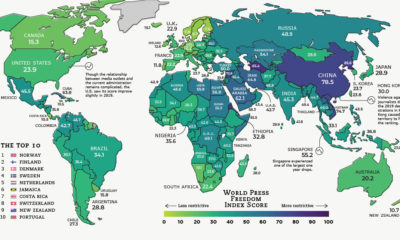

Global press freedom improved slightly in 2019, but censorship, intimidation, and violence remain a fact of life for many journalists around the world.


