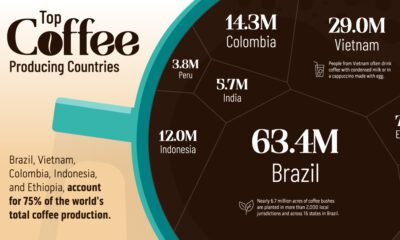

Coffee is the third most consumed beverage globally. Here we visualize the countries that have the highest coffee production in the world.
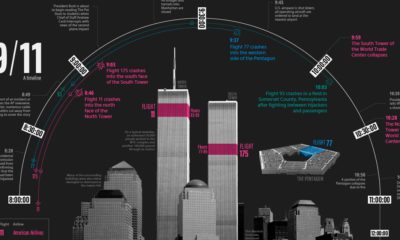

This timeline visualization is a high-level record of what happened on the fateful morning of September 11, 2001
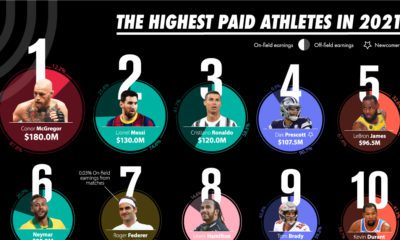

Athletes pull huge sums of money from their on-field and off-field contracts. Here we rank the top 50 highest-paid athletes in the world.


Our planet supports nearly 8.7 million species. We break down the total composition of the living world in terms of its biomass.
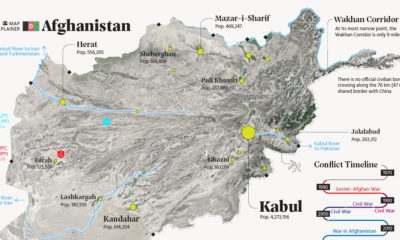

This map explainer looks at Afghanistan from a structural point of view, delving into geography and population patterns.
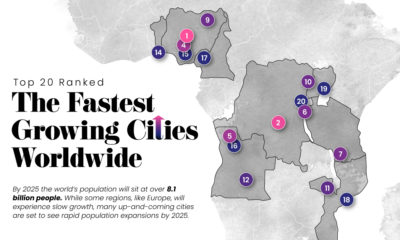

Nearly 60% of the world's population lives in cities and this trend is not slowing down—take a look at the world's 20 fastest growing cities.
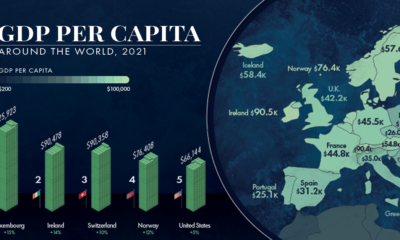

GDP per capita is one of the best measures of a country's standard of living. This map showcases the GDP per capita in every country globally.
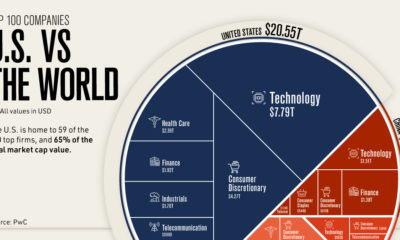

Where are the top 100 companies of the world located? We highlight the U.S. share of the top companies by market capitalization .
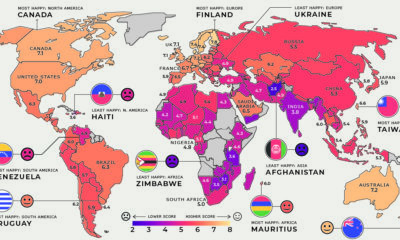

Global happiness levels are determined by many diverse factors. These maps look at the happiest and unhappiest countries in every region.
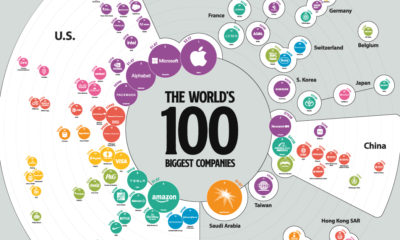

The 100 biggest companies in the world were worth a record-breaking $31.7 trillion as of the end of Q1, up 48% year-over-year.


