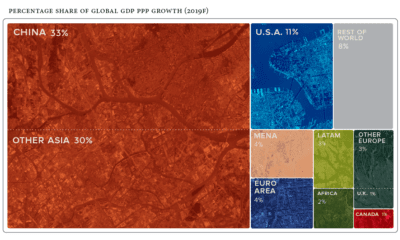

Global economics is effectively a numbers game - here are the countries and regions projected to contribute the most to global growth in 2019.
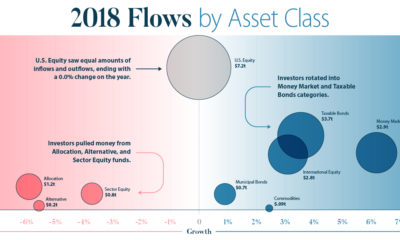

This infographic breaks down investment flows into funds (mutual funds, ETFs, etc.) over the course of 2018 to show how and when investors changed strategies.
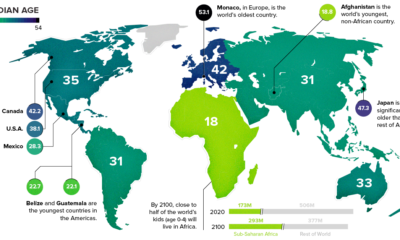

This chart takes a look at the median age of every continent, while also breaking down the youngest and oldest countries in the world.
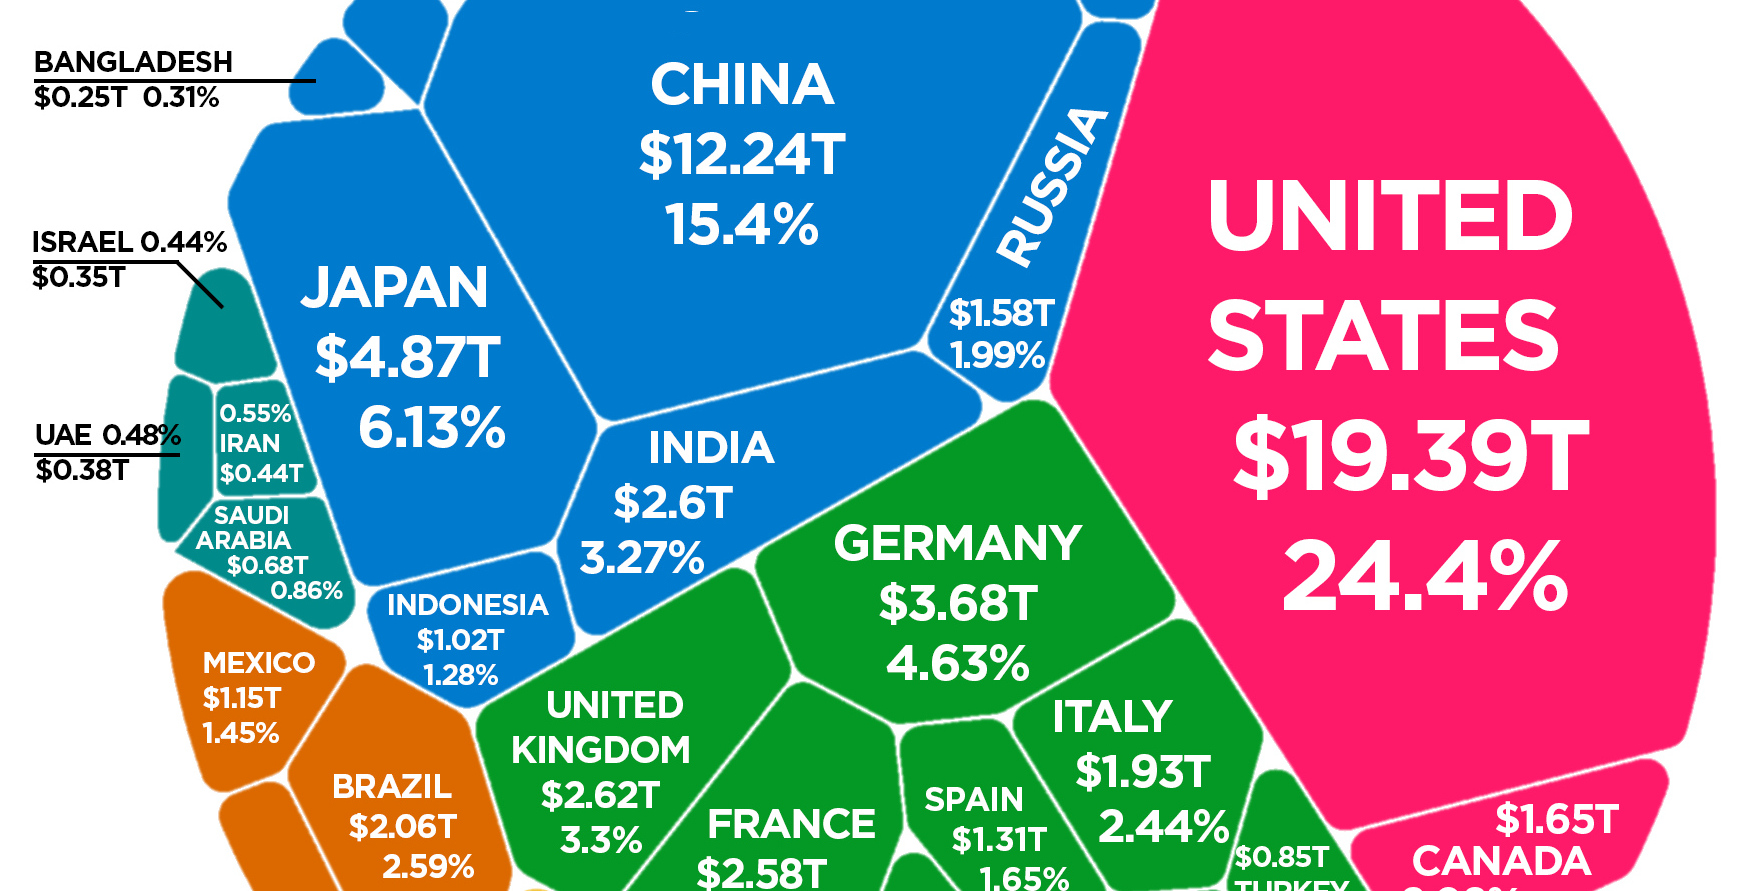
Latest estimates put the world economy at about $80 trillion in nominal GDP. Here is how each individual country stacks up in terms of size.
This special feature uses powerful charts and infographics to visualize the eight major forces that are shaping our global economy and the business landscape.


