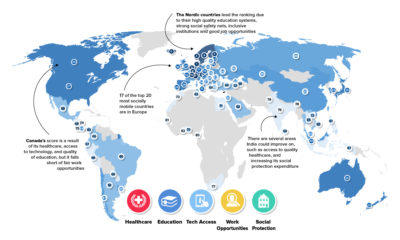

Ranked: The Social Mobility of 82 Countries It’s an unfortunate truth that a person’s opportunities can be partially tethered to their socioeconomic status at birth. Although...
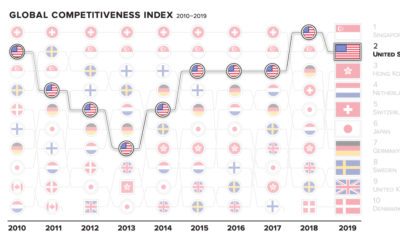

The world's top countries excel in many fields—but there can only be one #1. How have the most competitive economies shifted in the past decade?
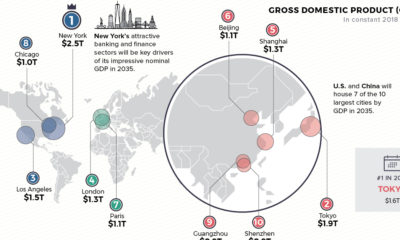

Cities are heavy hitters in the global economy. Where will the top 10 cities be in 2035—based on GDP, population, and annual growth?
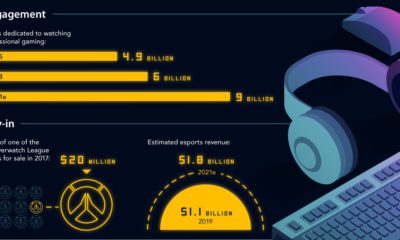

This infographic plots the journey of esports, from underground niche to a billion-dollar mainstream phenomenon—and it shows no signs of slowing down.
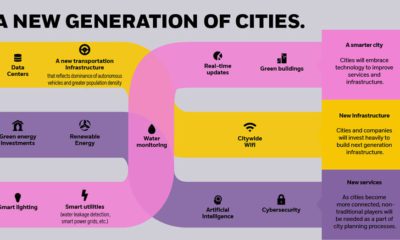

By 2050, there will be 2.5 billion more people living in cities than today. How is rapid urbanization set to impact investors and the global economy?v
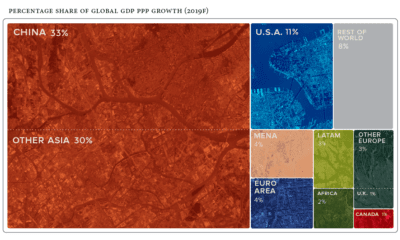

Global economics is effectively a numbers game - here are the countries and regions projected to contribute the most to global growth in 2019.
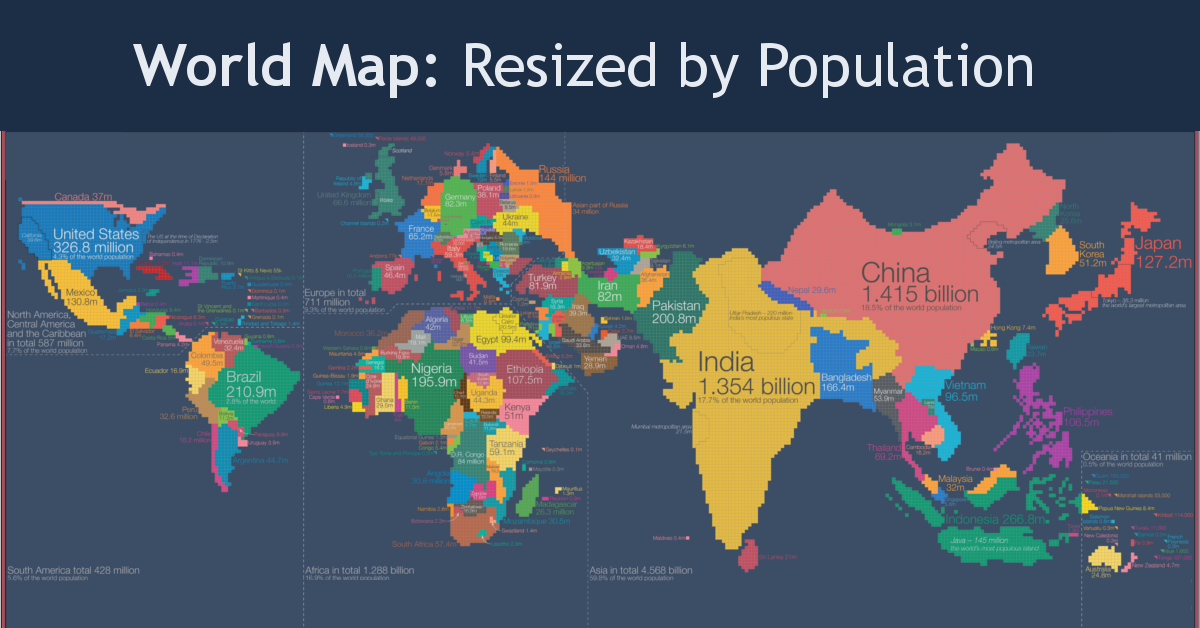
Look at global population in a whole new light, when countries on the world map are drawn based on population numbers instead of their usual borders.
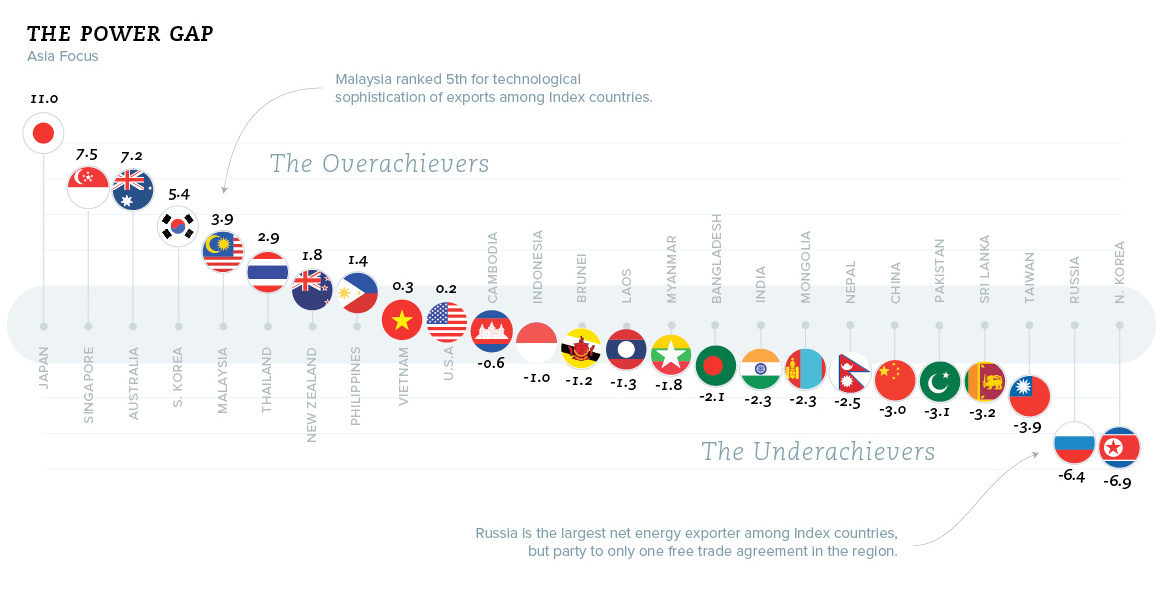
Charting the most influential countries in Asia, plus a look at the countries that punch above their weight class, in terms of power and influence.
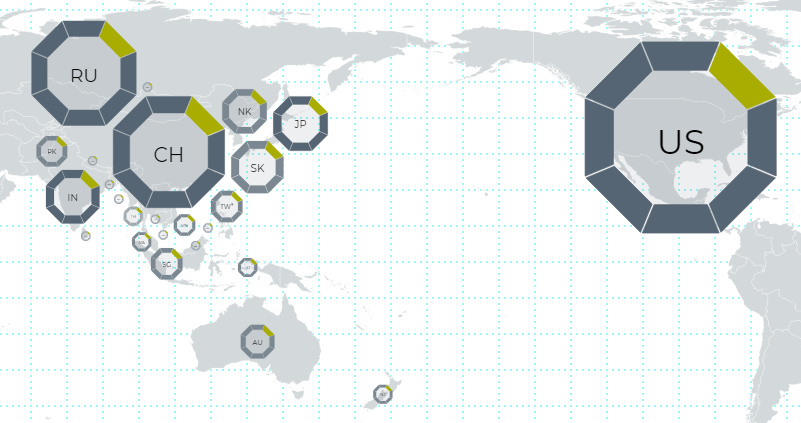
This interactive map uses 114 metrics to measure the geopolitical power and influence of 25 countries, focusing on Asian powers and the United States.
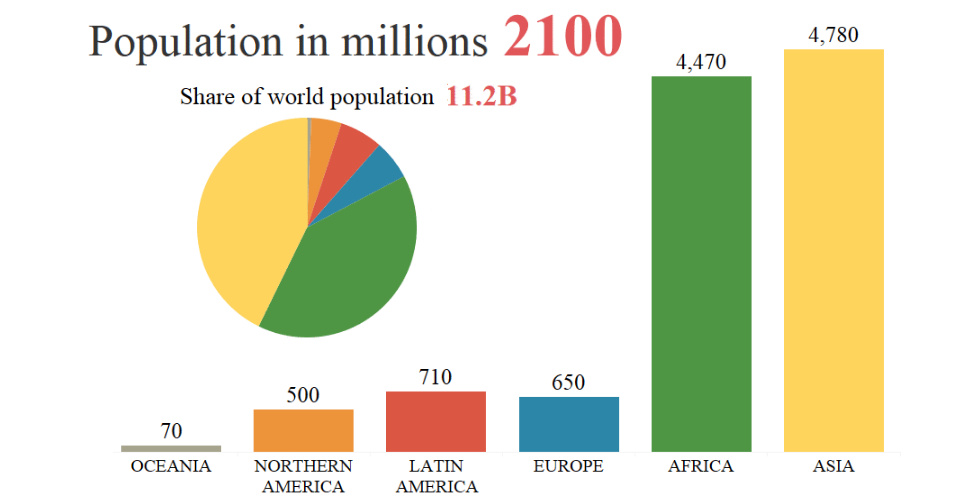
By 2100, the global population is projected to rise from 7.6 billion to 11.2 billion people. This animation shows how that growth will occur by region.