Markets
Visualizing the Meteoric Rise of Bond ETFs

Visualizing the Meteoric Rise of Bond ETFs
Bonds are a staple in almost any investment portfolio — but up until very recently, they weren’t exactly the easiest thing to own.
Despite the bond market being bigger than the equities market, bonds mostly trade over-the-counter (OTC) and not on any centralized exchange.
In fact, traders mostly swapped bonds over the phone, negotiating prices and making deals. However, this “old school” approach came with several disadvantages, including high transaction costs, illiquidity, and a lack of true transparency in the market.
A New Way to Play
Today’s infographic comes to us from iShares, and it shows that over the last two decades, the bond market has been dramatically transformed and democratized from the “old school” approach that relied on phones, traders, and giant bond calculators.
The biggest factor in this transition: the use of exchange-traded funds (ETFs) in the bond market, which just hit a new global milestone of $1 trillion of AUM in June 2019.
Let’s look at the journey of how this rapidly rising segment of the market took off, the factors driving it, and what the future may hold for Bond ETFs.
Bond ETFs: Journey to $1 Trillion
Below is a year-by-year account of new innovations in bond ETFs, and how the usage of them has changed over time:
2002: New tech
A new financial technology, the ETF, shakes up the bond market for the first time – and the first fixed income ETFs launch in the United States.
2003: More variety
Just one year in, and there are already numerous types of bond ETFs that allow investors to fulfill different portfolio needs:
- Government bond ETFs
- TIPS ETFs
- Corporate bond ETFs
- Aggregate bond ETFs
2006: Achievement unlocked
The global bond ETF industry hits $25 billion in AUM.
2007: Bond ETF innovations
The bond ETF universe continues to expand as investors demand even more options:
- Mortgage-backed security bond ETFs
- Muni bond ETFs
- High yield bond ETFs
2008: A new source of liquidity
Liquidity for individual bonds dries up during the 2008 Financial Crisis. However, bond ETFs step up to the plate by providing a new source of liquidity and volume increases, allowing investors to efficiently access fixed income markets.
2010: More precise strategies
The first term-maturity ETFs launch. These special bond ETFs specifically hold bonds that all mature in the exact same year.
2012: Achievement unlocked
The global bond ETF industry hits $250 billion in AUM.
2015: More product innovation
At this time, factor-based bond ETFs start to hit the mainstream. These use a rules-based approach to employ multiple investment factors, such as low volatility, quality, value, or momentum.
2016: Achievement unlocked
The global bond ETF industry hits $500 billion in AUM.
2017: Green bonds
Green bonds ETFs provide investors with the ability to invest in bonds that are tied to sustainability purposes.
2018: Market volatility and bond ETFs
In the second half of 2018, markets get volatile and investors turn to bond ETFs to help reduce their overall portfolio risk, specifically diversifying their exposure to stocks.
2019: Achievement unlocked
The global bond ETF industry hits $1 trillion in AUM, with now over 1,300 bond ETFs available.
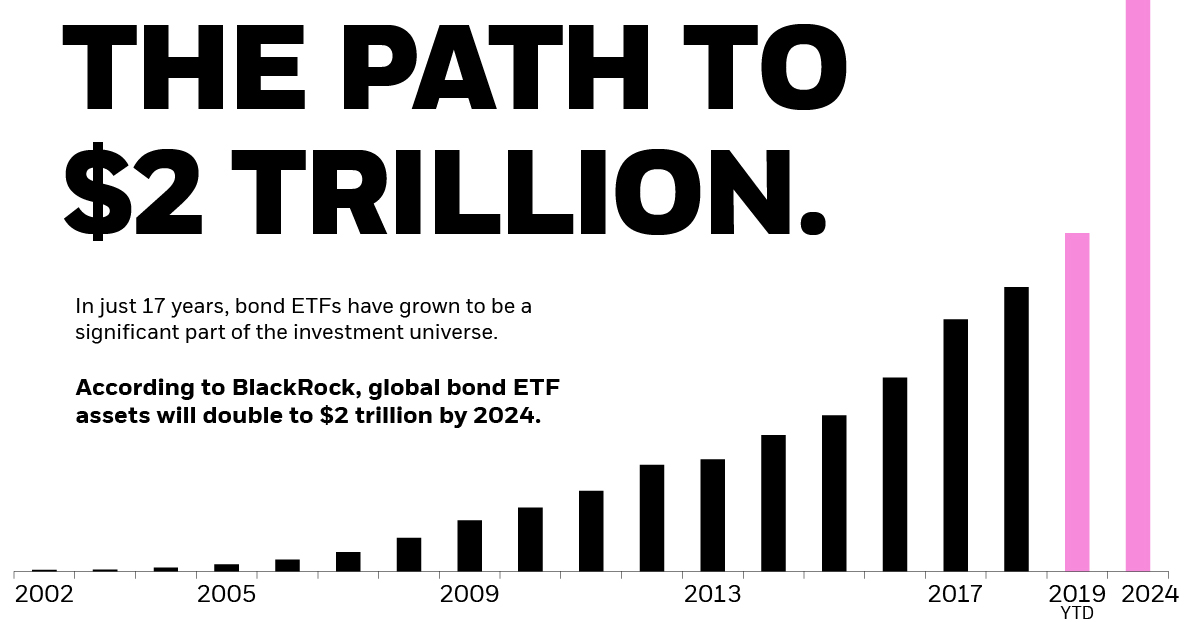
The Path to $2 Trillion?
In just 17 years, bond ETFs have grown to be a significant part of the investment universe, reaching $1 trillion AUM in 2019.
Impressively, it won’t likely take long to double the last milestone. According to BlackRock, it’s anticipated that ETFs will hold $2 trillion in AUM by the year 2024 — just a few short years down the road.


Markets
The European Stock Market: Attractive Valuations Offer Opportunities
On average, the European stock market has valuations that are nearly 50% lower than U.S. valuations. But how can you access the market?


European Stock Market: Attractive Valuations Offer Opportunities
Europe is known for some established brands, from L’Oréal to Louis Vuitton. However, the European stock market offers additional opportunities that may be lesser known.
The above infographic, sponsored by STOXX, outlines why investors may want to consider European stocks.
Attractive Valuations
Compared to most North American and Asian markets, European stocks offer lower or comparable valuations.
| Index | Price-to-Earnings Ratio | Price-to-Book Ratio |
|---|---|---|
| EURO STOXX 50 | 14.9 | 2.2 |
| STOXX Europe 600 | 14.4 | 2 |
| U.S. | 25.9 | 4.7 |
| Canada | 16.1 | 1.8 |
| Japan | 15.4 | 1.6 |
| Asia Pacific ex. China | 17.1 | 1.8 |
Data as of February 29, 2024. See graphic for full index names. Ratios based on trailing 12 month financials. The price to earnings ratio excludes companies with negative earnings.
On average, European valuations are nearly 50% lower than U.S. valuations, potentially offering an affordable entry point for investors.
Research also shows that lower price ratios have historically led to higher long-term returns.
Market Movements Not Closely Connected
Over the last decade, the European stock market had low-to-moderate correlation with North American and Asian equities.
The below chart shows correlations from February 2014 to February 2024. A value closer to zero indicates low correlation, while a value of one would indicate that two regions are moving in perfect unison.
| EURO STOXX 50 | STOXX EUROPE 600 | U.S. | Canada | Japan | Asia Pacific ex. China |
|
|---|---|---|---|---|---|---|
| EURO STOXX 50 | 1.00 | 0.97 | 0.55 | 0.67 | 0.24 | 0.43 |
| STOXX EUROPE 600 | 1.00 | 0.56 | 0.71 | 0.28 | 0.48 | |
| U.S. | 1.00 | 0.73 | 0.12 | 0.25 | ||
| Canada | 1.00 | 0.22 | 0.40 | |||
| Japan | 1.00 | 0.88 | ||||
| Asia Pacific ex. China | 1.00 |
Data is based on daily USD returns.
European equities had relatively independent market movements from North American and Asian markets. One contributing factor could be the differing sector weights in each market. For instance, technology makes up a quarter of the U.S. market, but health care and industrials dominate the broader European market.
Ultimately, European equities can enhance portfolio diversification and have the potential to mitigate risk for investors.
Tracking the Market
For investors interested in European equities, STOXX offers a variety of flagship indices:
| Index | Description | Market Cap |
|---|---|---|
| STOXX Europe 600 | Pan-regional, broad market | €10.5T |
| STOXX Developed Europe | Pan-regional, broad-market | €9.9T |
| STOXX Europe 600 ESG-X | Pan-regional, broad market, sustainability focus | €9.7T |
| STOXX Europe 50 | Pan-regional, blue-chip | €5.1T |
| EURO STOXX 50 | Eurozone, blue-chip | €3.5T |
Data is as of February 29, 2024. Market cap is free float, which represents the shares that are readily available for public trading on stock exchanges.
The EURO STOXX 50 tracks the Eurozone’s biggest and most traded companies. It also underlies one of the world’s largest ranges of ETFs and mutual funds. As of November 2023, there were €27.3 billion in ETFs and €23.5B in mutual fund assets under management tracking the index.
“For the past 25 years, the EURO STOXX 50 has served as an accurate, reliable and tradable representation of the Eurozone equity market.”
— Axel Lomholt, General Manager at STOXX
Partnering with STOXX to Track the European Stock Market
Are you interested in European equities? STOXX can be a valuable partner:
- Comprehensive, liquid and investable ecosystem
- European heritage, global reach
- Highly sophisticated customization capabilities
- Open architecture approach to using data
- Close partnerships with clients
- Part of ISS STOXX and Deutsche Börse Group
With a full suite of indices, STOXX can help you benchmark against the European stock market.
Learn how STOXX’s European indices offer liquid and effective market access.

-

 Economy2 days ago
Economic Growth Forecasts for G7 and BRICS Countries in 2024
The IMF has released its economic growth forecasts for 2024. How do the G7 and BRICS countries compare?
-

 Markets2 weeks ago
U.S. Debt Interest Payments Reach $1 Trillion
U.S. debt interest payments have surged past the $1 trillion dollar mark, amid high interest rates and an ever-expanding debt burden.
-

 United States2 weeks ago
Ranked: The Largest U.S. Corporations by Number of Employees
We visualized the top U.S. companies by employees, revealing the massive scale of retailers like Walmart, Target, and Home Depot.
-

 Markets2 weeks ago
The Top 10 States by Real GDP Growth in 2023
This graphic shows the states with the highest real GDP growth rate in 2023, largely propelled by the oil and gas boom.
-

 Markets2 weeks ago
Ranked: The World’s Top Flight Routes, by Revenue
In this graphic, we show the highest earning flight routes globally as air travel continued to rebound in 2023.
-

 Markets3 weeks ago
Ranked: The Most Valuable Housing Markets in America
The U.S. residential real estate market is worth a staggering $47.5 trillion. Here are the most valuable housing markets in the country.


-

 Debt1 week ago
How Debt-to-GDP Ratios Have Changed Since 2000
-
Markets2 weeks ago
Ranked: The World’s Top Flight Routes, by Revenue
-

 Countries2 weeks ago
Population Projections: The World’s 6 Largest Countries in 2075
-
Markets2 weeks ago
The Top 10 States by Real GDP Growth in 2023
-

 Demographics2 weeks ago
The Smallest Gender Wage Gaps in OECD Countries
-

 United States2 weeks ago
Where U.S. Inflation Hit the Hardest in March 2024
-

 Green2 weeks ago
Top Countries By Forest Growth Since 2001
-
United States2 weeks ago
Ranked: The Largest U.S. Corporations by Number of Employees