Business
Pandemic Recovery: Have North American Downtowns Bounced Back?


Pandemic Recovery: Have Downtowns Bounced Back?
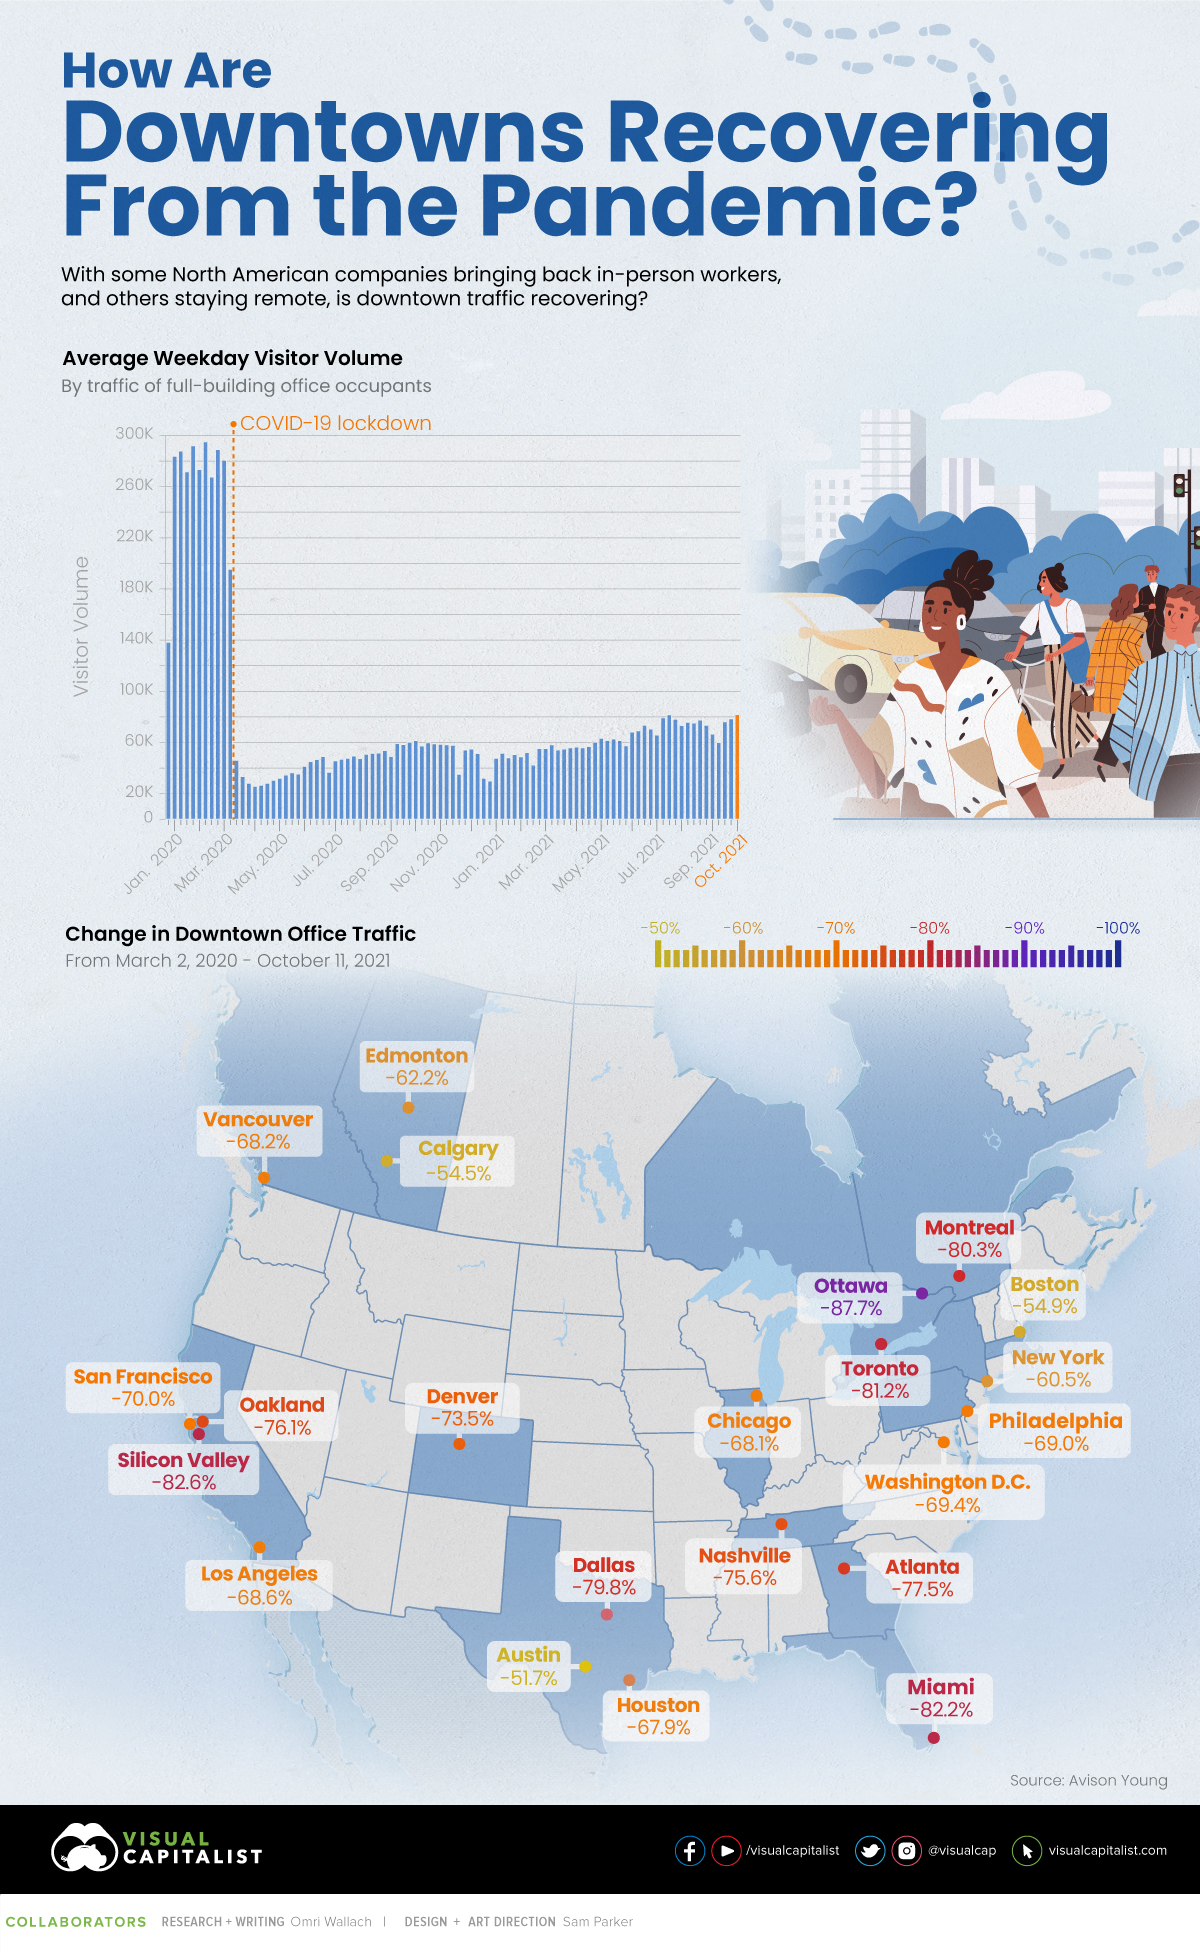
As we continue on our journey towards recovery from the impacts of the pandemic, North American offices that sat empty for months have started to welcome back in-person workers.
This small step towards normalcy has sparked questions around the future of office life—will office culture eventually bounce back to pre-pandemic levels, or is remote work here to stay?
It’s impossible to predict the future, but one way to gauge the current state of office life is by looking at foot traffic across city centers in North America. This graphic measures just that, using data from Avison Young.
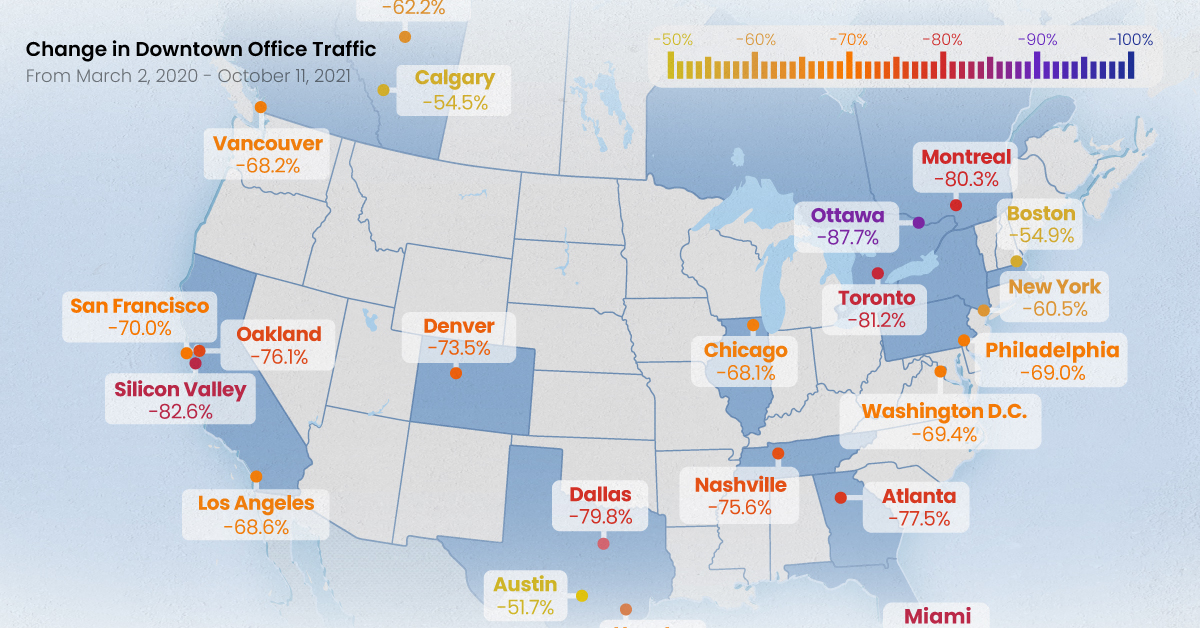
Change in Downtown Office Traffic
According to the data, which measures foot traffic in major office buildings in 23 different metropolitan hubs across North America, remains drastically below pre-pandemic levels.
Across all major cities included in the index, average weekday visitor volume has fallen by 73.7% since the early months of 2020. Here’s a look at each individual city’s change in foot traffic, from March 2, 2020 to Oct 11, 2021:
| City | Country | Change in Foot Traffic |
|---|---|---|
| Austin | 🇺🇸 | -51.70% |
| Calgary | 🇨🇦 | -54.50% |
| Boston | 🇺🇸 | -54.90% |
| New York | 🇺🇸 | -60.50% |
| San Francisco | 🇺🇸 | -60.80% |
| Edmonton | 🇨🇦 | -62.20% |
| Houston | 🇺🇸 | -67.90% |
| Chicago | 🇺🇸 | -68.10% |
| Vancouver | 🇨🇦 | -68.20% |
| Los Angeles | 🇺🇸 | -68.60% |
| Philadelphia | 🇺🇸 | -69.00% |
| Washington, DC | 🇺🇸 | -69.40% |
| San Francisco Peninsula | 🇺🇸 | -70.00% |
| Denver | 🇺🇸 | -73.50% |
| Nashville | 🇺🇸 | -75.60% |
| East Bay/Oakland | 🇺🇸 | -76.10% |
| Atlanta | 🇺🇸 | -77.50% |
| Dallas | 🇺🇸 | -79.80% |
| Montreal | 🇨🇦 | -80.30% |
| Toronto | 🇨🇦 | -81.20% |
| Miami | 🇺🇸 | -82.20% |
| Silicon Valley | 🇺🇸 | -82.60% |
| Ottawa | 🇨🇦 | -87.70% |
The Canadian city of Calgary is a somewhat unique case. On one hand, foot traffic has bounced back stronger than many other downtowns across North America. On the other hand, the city has one of the highest commercial vacancy rates in North America, and there are existential questions about what comes next for the city.
Interestingly, a number of cities with a high proportion of tech jobs, such as Austin, Boston, and San Francisco bounced back the strongest post-pandemic. Of course, there is one noteworthy exception to that rule.
A Tale of Two Cities
Silicon Valley has experienced one of the most significant drops in foot traffic, at -82.6%. Tech as an industry has seen one of the largest increases in remote work, as Bay Area workers look to escape high commuter traffic and high living expenses. A recent survey found that 53% of tech workers in the region said they are considering moving, with housing costs being the primary reason most respondents cited.
Meanwhile, in a very different part of North America, another city is experienced a sluggish rebound in foot traffic, but for very different reasons. Ottawa, Canada’s capital, is facing empty streets and struggling small businesses that rely on the droves of government workers that used to commute to downtown offices. Unlike Silicon Valley, where tech workers are taking advantage of flexible work options, many federal workers in Ottawa are still working from home without a clear plan on returning to the workplace.
It’s also worth noting that these two cities are home to a lot of single-occupant office buildings, which is a focus of this data set.
Some Businesses Remain Hopeful
Despite a slow return to office life, some employers are snapping up commercial office space in preparation for a potential mass return to the office.
Back in March 2021, Google announced it was planning to spend over $7 billion on U.S. office space and data centers. The tech giant held true to its promise—in September, Google purchased a Manhattan commercial building for $2.1 billion.
Other tech companies like Alphabet and Facebook have also been growing their office spaces throughout the pandemic. In August 2021, Amazon leased new office space in six major U.S. cities, and in September 2020, Facebook bought a 400,000 square foot complex in Bellevue, Washington.
Will More Employees Return or Stay Remote?
It’s important to note that we’re still in the midst of pandemic recovery, which means the jury’s still out on what our post-pandemic world will look like.
Will different cities and industries eventually recover in different ways, or are we approaching the realities of “new normal” foot traffic in North American city centers?


Business
The Top Private Equity Firms by Country
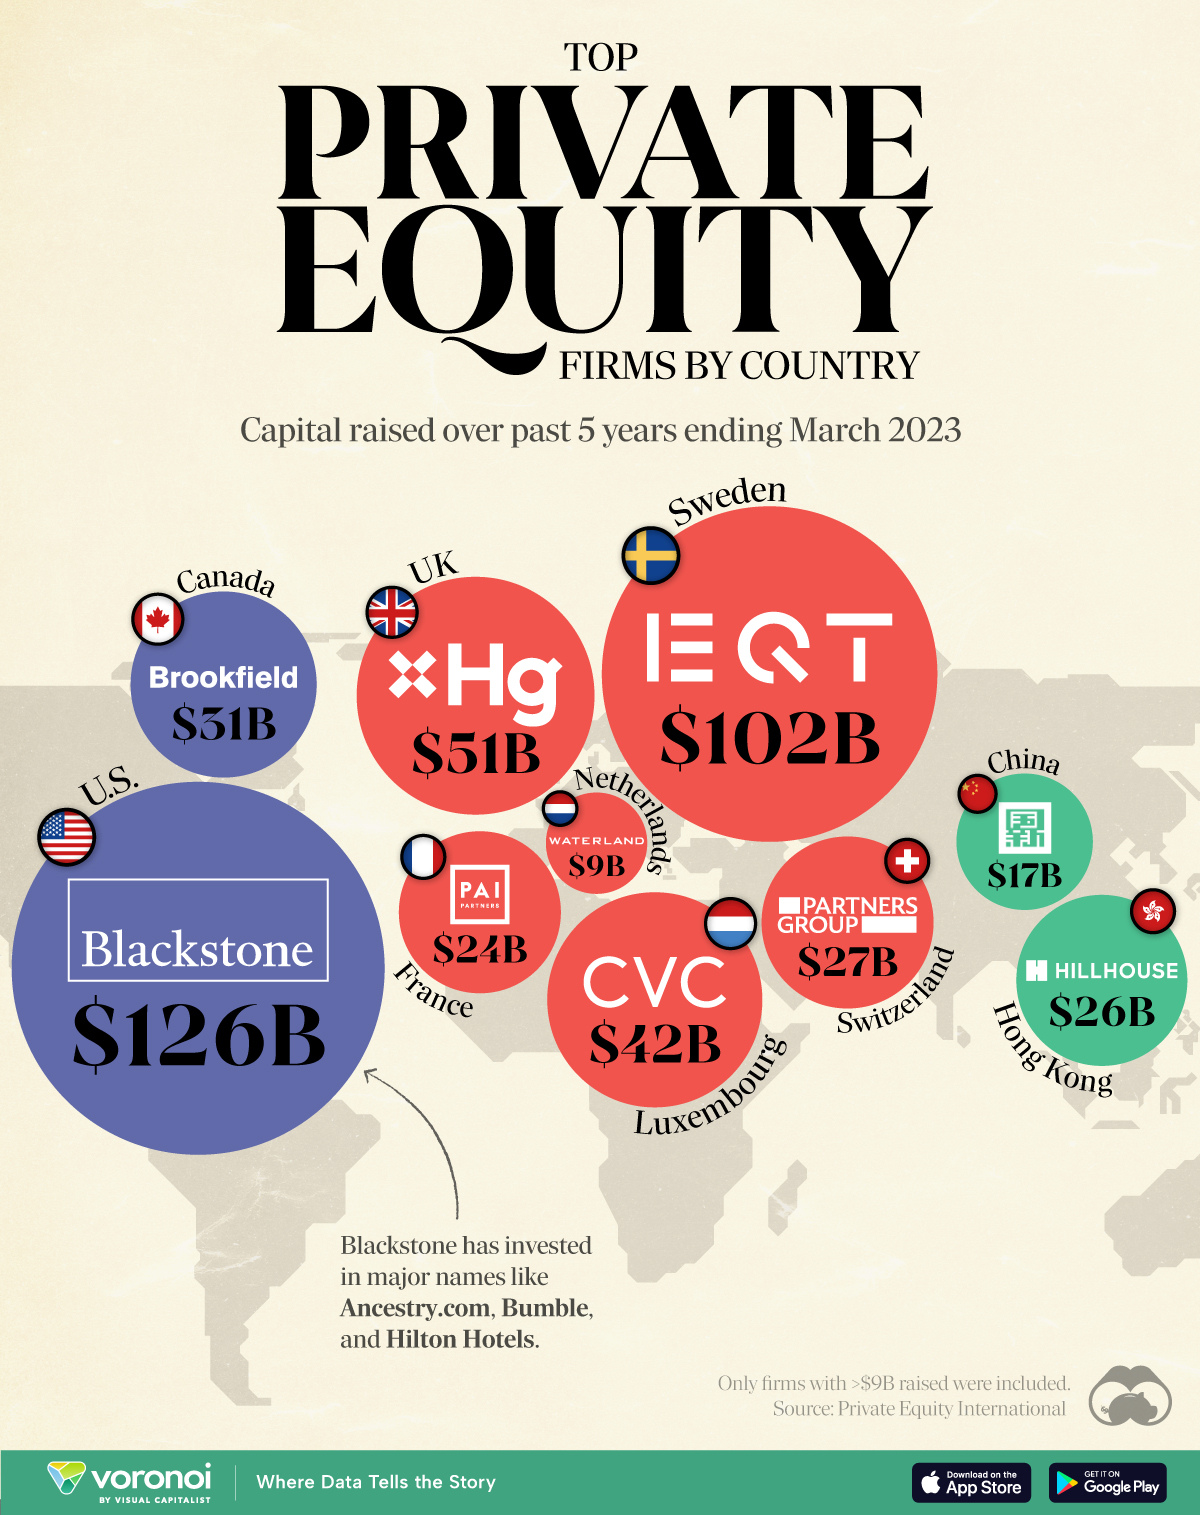
This map visualizes the leading private equity firms of major countries, ranked by capital raised over the past five years.
The Top Private Equity Firms by Country
This was originally posted on our Voronoi app. Download the app for free on iOS or Android and discover incredible data-driven charts from a variety of trusted sources.
Private equity firms are investment management companies that pool investor capital to acquire stakes in private companies. Through strategic management, they aim to enhance the value of these companies, then profit from a future sale or public offering.
To gain insight into this industry, we’ve visualized the top private equity firms in various countries, ranked by the amount of capital they raised over the past five years ending March 2023.
The cutoff for inclusion in this graphic was $9 billion raised. All figures come from Private Equity International’s PEI 300 ranking.
Data and Highlights
The data we used to create this graphic is included in the table below.
| Country | Firm | Amount raised |
|---|---|---|
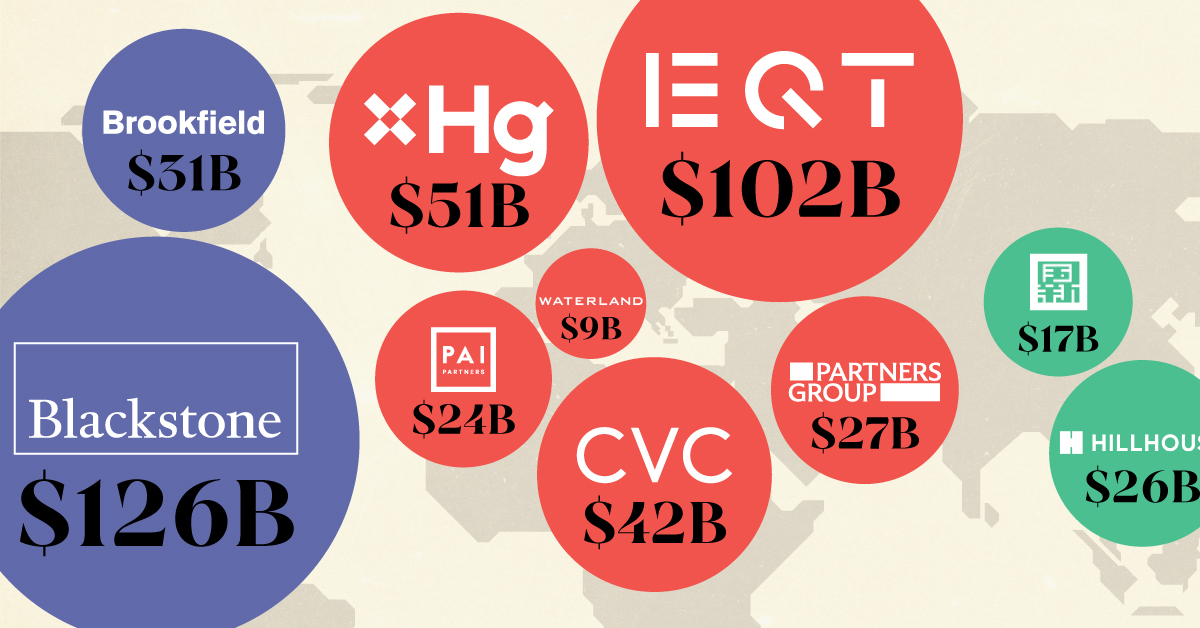
| 🇺🇸 US | Blackstone | $126B |
| 🇸🇪 Sweden | EQT | $102B |
| 🇬🇧 UK | Hg | $51B |
| 🇱🇺 Luxembourg | CVC Capital Partners | $42B |
| 🇨🇦 Canada | Brookfield Asset Management | $31B |
| 🇨🇭 Switzerland | Partners Group | $27B |
| 🇭🇰 Hong Kong | Hillhouse Capital Group | $26B |
| 🇫🇷 France | PAI Partners | $24B |
| 🇨🇳 China | China Reform Fund Management Corp | $17B |
| 🇳🇱 Netherlands | Waterland Private Equity | $9B |
U.S.-based Blackstone is the world’s largest private equity firm, with operations in additional areas like credit, infrastructure, and insurance.
While not shown in this graphic, the U.S. largely dominates the private equity landscape. If we were to rank the top 10 private equity firms by the same metric (capital raised over past five years), U.S. firms would account for eight of them.
More About Blackstone
Blackstone was founded in 1985 by Peter G. Peterson and Stephen A. Schwarzman, both former Lehman Brothers employees.
Notably investments that Blackstone has made include Ancestry.com, where it acquired a majority stake for nearly $5 billion in 2020.
In 2007, it also acquired Hilton Worldwide (one of the world’s biggest hotel operators) for roughly $26 billion.
Sweden’s EQT
EQT is Sweden’s largest private equity firm, and third largest globally. It is just one of three firms that have raised over $100B in capital over the past five years alongside Blackstone and KKR (also American).
EQT made news earlier this year when it raised $24B in two years for its EQT X private equity fund, which invests in the healthcare, technology and tech-enabled service sectors.
If you found this post interesting, check out this graphic that visualizes the most common types of investments that financial advisors use with their clients.

-

 Technology6 days ago
All of the Grants Given by the U.S. CHIPS Act
-

 Uranium2 weeks ago
The World’s Biggest Nuclear Energy Producers
-

 Education2 weeks ago
How Hard Is It to Get Into an Ivy League School?
-

 Debt2 weeks ago
How Debt-to-GDP Ratios Have Changed Since 2000
-

 Sports2 weeks ago
The Highest Earning Athletes in Seven Professional Sports
-

 Science2 weeks ago
Visualizing the Average Lifespans of Mammals
-

 Brands1 week ago
How Tech Logos Have Evolved Over Time
-

 Energy1 week ago
Ranked: The Top 10 EV Battery Manufacturers in 2023